Download
1 / 20
200 likes | 488 Views
Political Parties in Texas. Topical Scenario Party Organization Party in the Electorate Party in Government Parties in Transition. Topical Scenario. 19th Century Challenge to Democrats 70% of Texans Employed in Agriculture Cotton Price Falls Crop-lien System

E N D
Political Parties in Texas • Topical Scenario • Party Organization • Party in the Electorate • Party in Government • Parties in Transition
Topical Scenario • 19th Century Challenge to Democrats • 70% of Texans Employed in Agriculture • Cotton Price Falls • Crop-lien System • Farmers Alliance - Interest Group • 1890 Regulating Railroads Major Issue • People Party of Texas - 1891 • Influence peaked in 1894 • National Democrats adopts Peoples Party issues in 1896
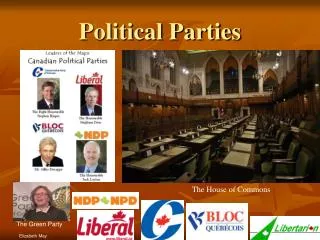
Political Parties • Political party is a group dedicated to controlling rather than just influencing the government. • Components of parties • Party Organization • Temporary and Permanent • Formal and Functional • Party in the Electorate • Party in the Government • Democrats, Republicans, Greens, Libertarians, Socialists, Workers
Texas Party Heritage • Southern Democrats (1836 to 1990) • War Party versus Peace Party • Unionist versus Secessionist • Populist versus Business Interests • Conservative (Tory) versus Liberal • Republicans • Reconstructionists (1866 - 1872) • Of no consequence • From John Tower (1961) to George Bush (1994)
Established by state law Precinct - Convention after primary Elected Precinct Chair address local party issues and candidates send 1 delegate/25(R)-15(D) voters for Gubernatorial nominee to county convention. County or Senatorial District Convention Elected County Chair held 3rd Saturday after primaries address county issues and candidates send 1 delegate/300(R) -180(D) voters to state convention Party Organization - FormalTemporary
Held in June Certify primary results and nominees Adopt party platform Select Executive Committee Select electoral delegates Select members for national committee Select delegates to national convention Party Organization - FormalTemporary State Convention
All levels represented Each level independent, concentrates on elections at that level Precinct chairperson sit on county executive committee Arrange primaries, conventions, fund raisers, and support campaigns State Executive Committee Chair and vice 2 reps from each senatorial district certify candidates, conduct conventions Party Organization - FormalPermanent
Functional Organization • Actual operation of party apparatus • Governors Role • Democrats • After Populist challenge more personality than ideology • 1944 liberal - conservative split occurs based on support for FDR (electoral slate issue) • Liberals consolidate and increase power • Power peaks in late 80’s early 90’s with Ann Richards, Jim Mattox, Gary Mauro • 43% liberal 31% moderates 26% conservative
Republican Functional Organization • Not competitive until 1970’s • John Tower elected Senator, grass roots activity increases, PR and fund raising improves, recruit competitive candidates • Initially less intraparty conflict • 3% Liberals 12% Moderates86% Conservative • Split between pragmatists (economics and governing) and social conservatives (traditional family values) • Conflict has intensified
Party in the Electorate • Most important party function - elections • Voter who identifies with party in electorate - psychological attachment • Voter does not register party affiliation • Until 1940 80% of electorate supported Gubernatorial Democratic candidate • 1952 Democratic power peaked at 66% • 1990 Split 30% - 30% - 30% • 2001 36% Rep 24% Dem 26% Indepnd 8% Other 6% Don’t care or know • 2004 42% Rep 33% Dem 25% Ind
Socio/Geographic Distribution • Democrats - North Central, East, Rio Grande Valley, urban, lower income and education tend to be more liberal. Western, rural, higher income and education tend to be more conservative. • Republicans - Panhandle, West, Hill country, suburbs, higher income and education.
Primary Identifiers/Positions • Democrats - tend to be liberals, populists, have lower incomes and education, are minorities and female. • Bigger government, higher taxes, more social spending, less social regulating. • Republicans - tend to be conservatives, libertarians, have higher incomes and educations, are Anglos, Christian Rights supporters and male. • Smaller government, lower taxes, less social spending, more social regulating.
Party in Government • Mechanism for establishing cooperation among separate branches by elected party officials. • Plural Executive - 8 separate Offices • Creates intraparty competition • Causes crossparty cooperation • Legislative Cooperation • Party Caucuses • Democrats since 1981 • Republicans since 1/3 threshold passed • Judicial Appointments • Elections • Gubernatorial appointments
Parties and Change • A party realignment has seen an increase in republican party power and influence. • Usually triggered by critical election. • Conservative immigration, young voters, party switching • Dealignment versus realignment • Although the largest party is now the Republicans, some consider Texas a no party state because of the influence of the independent voters.
Governor - Democrat 1964 Presidential Election Senate 30 Dem 1 Rep House 132 Dem 18 Rep
Governor - Democrat 1992 Presidential Election Senate 17 Dem 14 Rep House 92 Dem 58 Rep
Governor - Republican 1996 Presidential Election House 86 Dem 64 Rep Senate 17 Rep 14 Dem
All State Wide Offices - Republican 2000 (04) Presidential Election Senate 16 Rep (19) 15 Dem (12) House 78 Dem (63) 72 Rep (87)