Download
1 / 27
280 likes | 442 Views
International Conference on Climate Change. Impact of Sea Level Rise on storm surge in Hong Kong and the Pearl River Delta by WONG, Agnes K.M. LAU, Alexis K.H. GRAY, Joseph P. (The Hong Kong University of Science and Technology) 31 May 2007.

E N D
International Conference on Climate Change Impact of Sea Level Rise on storm surge in Hong Kong and the Pearl River Delta by WONG, Agnes K.M. LAU, Alexis K.H. GRAY, Joseph P. (The Hong Kong University of Science and Technology) 31 May 2007
Did you know that the Pearl River Delta is already under threat from severe flooding?
Guangzhou in flood due to astronomical tide: School is cancelled for 100,000 students 190 flood events have been recorded in PRD over the last 40 years (Huang et al, 2004) June 2005 NOT rain related
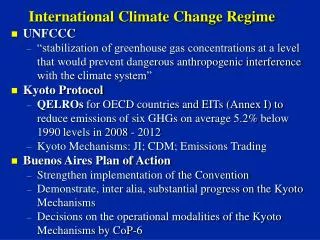
Coastal Flooding • Astronomical tide • Shape of coast • Accumulated rain water • Tropical cyclone • Global warming (sea level rise) • Storm surge
Storm Surge • The abnormal rise in the ocean level associated with typhoon landfall.
Global Situation Intergovernmental Panel on Climate Change (IPCC) report in 2007: • An average rate of 1.8mm/yr for 1961-2003 • Faster rate of 3.1mm/yr for 1993-2003 • Total sea level rise for 20th century is estimated to be 0.17m
22cm 10cm Time series of global mean sea level IPCC 2007
Local Situation (HKO, 2004) The observed rate of sea level rise in Hong Kong is faster than the global average report by the IPCC (2007)
IPCC (2007) Report • Storm surges are especially serious when they coincide with high tide. Changes in the frequency of occurrence (i.e. return period) are affected both by changes in mean sea level and in the meteorological phenomena causing the extremes. There is evidence for an increase in the occurrence of extreme high water worldwide related to storm surges
HKO’s findings Hong Kong Observatory (HKO) research in 2004: • The 50 yr return period would be shortened to about 3 yrs if the sea level rises by 48cm in 2100 • A 50yr event could even become an annual event if sea level rises by 88cm
Practical use of return period • Formation levels for reclamations - streets and pavements • Flood defence levels for critical facilities - building basements, MTR • Crest levels for seawalls and river banks • Tailwater levels and other hydraulic design - stormwater and sewage systems S. Buttling & M.L. Chalmers
Design Life • Normally, the extreme environmental conditions for structures having a design life of 50 years should be taken as those having return periods of 100 years. Port Works Design Manual : Part 1
Objective of this study • To see how the probability of destructive flooding (return period of extreme flooding events) changes with increasing mean sea level • To understand the relationship between sea level rise and storm surge
Data • Sea Level records around HK from HKO • Period: 1965 - 2006
Methodology • Gumbel cumulative distribution - extreme value type I • Parameter estimation with the moment method • It is used to find the maximum of a number of samples of various distributions. It is useful in predicting the chance that an extreme flood will occur.
100 yr 20 yr Significant increase in extreme value in last 20 years Extreme value ranged between 3 to 4 meters
IPCC Sea level rise estimate for 2050 IPCC Sea level rise estimate for 2100 If the MSL reaches the lower limit of IPCC’s predication for 2100, the return period would be decreased to less than 5 yrs If the MSL reaches the lower limit of IPCC’s predication for 2050, a 20-yr event would become a 10-yr event Current 20 year event Current return period for a 3.2 m event (20 yr)
IPCC Sea level rise estimate for 2050 IPCC Sea level rise estimate for 2100 If the MSL reach the lower limit of IPCC’s predication for 2100, the structure’s design life would be reduced by roughly 75% If the MSL reach the lower limit of IPCC’s predication for 2050, the structure’s design life would be halved Current 100 year event Event level used for a marine work with a 50yr design life
ConstantProtection In Phase Evolving Protection Population annually affected by flood Robert J. Nicholls 2004
Land Use Map in PRD Red– highly developed area Current Situation
Land Use Map in PRD Red– highly developed area Flooding of 3m
Land Use Map in PRD Red– highly developed area Flooding of 4m
Economic Impacts Economic Losses from sea level rise in the PRD Warrick, Barrow & Wigley
Summary & Discussion • The PRD is already susceptible to severe flooding • The observed sea level rise in the region is faster than the global average • The sea level rise projected by the IPCC results in a significant decrease in the return period in the region, implying a significant reduction of the design life of coastal constructions • We need to act swiftly to mitigate the flooding potential caused by climate change
Action Items • Building regulations should be reviewed to reflect the potential risks related to climate change • Environmental responsible policies should be adopted to reduce our contribution to Global Warming • Further research work should be done to better understand the rise of sea level and its impact on the region
Acknowledgment • Prof. S.C. Kot for his guidance • Dr. Jimmy Chan for his graphics • Hong Kong Observatory for provision of historical sea level data around Hong Kong