Download
1 / 37
370 likes | 477 Views
Alberta’s Economic Prospects and Regional Impacts. Presentation to CAEP REDA March 3, 2011. Alberta’s Economic Prospects and Regional Impacts. CAEP Presentation March 3, 2011. Is World Economy’s Recovery Sustainable?.

E N D
Alberta’s EconomicProspects and Regional Impacts Presentation to CAEP REDA March 3, 2011
Alberta’s EconomicProspects and Regional Impacts CAEP Presentation March 3, 2011
Is World Economy’s Recovery Sustainable? • Uneven global recovery, with widespread financial and fiscal turbulence • Weak recovery in Europe: ongoing financial risks due to Greek and Irish crises; German economy doing very well • Modest recovery in North America; new round of quantitative easing in US improves US outlook • Sharp recovery in emerging markets, led by China, India and Brazil (but some risk for China) • Very high government debt: Japan, Ireland, Italy, US, UK • Removal of fiscal and monetary stimulus needs to be done carefully • Very weak labour and housing markets in US • Political instability in Middle East may disrupt oil supplies
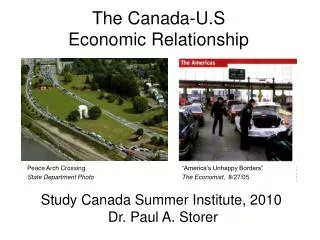
Canada in Better Shape than US? • Canada’s recovery is built on strength of domestic economy, but stronger revival in US employment is key to maintaining momentum in 2011 • Economic growth was weaker than expected in Q3, but rebounded in Q4 ’10 • Budding core inflation, higher energy prices and rising sales taxes have prompted BoC to start lifting rates • High commodity prices will keep Loonie strong • Real GDP growth of 3.1% in ’10; 2.7% in ’11 as domestic economy and government spending cools
Alberta on the Rebound • Alberta is now out of recession: high energy prices; global recovery; surging oil investment • Alberta’s GDP fell by 4.5% in 2009: falling investment and exports; large 20%+ declines for manufacturing, agriculture, construction • Strong employment gains in 2nd half ’10 and Jan ’11 • Budget: Alberta GDP up 3.5% in ’10 (consensus +3.2%) • Until 2008 the economy was growing at rates well beyond its capacity • Recent slowdown has eased pressures on housing and infrastructure and reduced inflation
Current Alberta Indicators • Building permits up 2.1% in ’10 • Housing starts up 36% in ’10 • MLS sales down 14% • Retail sales up 5.5%; car sales up 9.3% • Oil production up 6.5%; gas production down 5.5% • Employment down 0.4% • Manufacturing sales up 10.9% • Farm cash receipts down 5.9% • Exports up 11.3% (high oil prices)
Real GDP GrowthAlberta vs. World, Canada and U.S. Sources: Statistics Canada, Bureau of Economic Analysis (historical); average of recent forecasts by Conference Board of Canada, and major Canadian banks; EIU (World)
Unemployment RateAlberta Economic Regions(January 2011) Wood Buffalo – Cold Lake 4.5% Athabasca-Grande Prairie 6.1% Edmonton Region 5.7% Red Deer Region 5.2% Banff-Jasper Rocky Mtn. House 5.9% Calgary Region 5.9% Camrose-Drumheller5.0% Lethbridge-Medicine Hat 4.3% Provincial Rate 5.6% Note: regional and provincial rates are 3-month averages Source: Statistics Canada, Labour Force Survey Source: Statistics Canada, Labour Force Survey
Industry Sector Prospects • Rising value of the Canadian dollar may limit export growth to the US, but US outlook has improved • Oil prices are relatively higher than natural gas prices; long-run oil prices driven by growth in China and India • US shale gas means gas prices will stay low, but domestic demand for gas is on the rise (oilsands/power) • High oil prices should stimulate investment in 2011 • Agriculture prices have rebounded: growing demand in Asia and biofuels; COOL impacting livestock/meat • Forestry prices are recovering, except for OSB prices
Data and Analysis for Central Alberta Region(New REIR reports on http://www.albertacanada.com/about-alberta/regional-economic-indicators.html)
Differences in Geography CAEP vs Central Region • Part of Central Region;non-member CAEP:Acme; Botha;Cremona; Delia; • Linden; Morrin; Munson; Starland County; Ponoka County • Member of CAEP; not part of Central Region: • Castor; Halkirk; Paintearth
Population Estimates Source: Statistics Canada
Population Estimates Source: Statistics Canada
Age Pyramid • 20-40 year-olds have smaller share in CA than in AB • 0-20 have larger share • 44+ identical shares Source: Statistics Canada
Regional Labour Force • In 2009, regional labour force and employment continued to increase, but likely declined in 2010 • Unemployment rate: 6.7% in ’09 - up from 3.8% in ’08; declined in 2010 • Participation Rate: 72.7% (labour force/population 15+) • Largest sectors in ’09: Retail/Construction (about 20,000 each); Healthcare/Oil and Gas (15,000 to 20,000) • Sectors with >10,000: Agriculture; Manufacturing; Other Services; Education • 4,800 workers received EI in ’09 (up from 1,500 in ’08) • EI down 42% Q4 ’09 to Q4 ’10; AB down 31%
Regional Agriculture • Number of farms: 10,477; 21.2% of AB • Farm cash receipts: $1.75 billion; 17.7% of AB • Land in crops: 3.8 million acres; 15.8% of AB • Canola: 631,000 acres; 15.5% of AB • Barley: 879,000 acres; 21.5% of AB • Wheat (incl. durum): 824,000 acres; 12.7% of AB • Value of livestock: $970 million;19.4% of AB • Cattle and calves: 1.21 million; 19.0% of AB • Hogs: 599,000; 29.2% of AB
Beef Industry Consolidating • Herd reduction: US 3.9% down between ’07 and ’11 • Canada and Alberta down 17% between ’05 and ’11 Source: Statistics Canada
Pork in Precarious State • Shrinking herd - Losses ongoing • Smaller industry likely - Exchange rate key Source: Statistics Canada
Regional Agriculture Sources: Statistics Canada and AAFRD
Regional Manufacturing • Estimates for Census Division 8 (2/3 of CA population) • In 2008, manufacturing shipments $7.5 billion, up 5.4% from ’07 • CD 8 accounts for 10.6% of Alberta manufacturing • Employment 6,500: 4.5% of Alberta manufacturing jobs • Largest sector: chemicals ($5.6 billion or >50% of AB) • #2 sector: food ($630 million or 6% of AB) • #3 sector: O&G machinery ($300+ million or 5% of AB) Sources: Statistics Canada
Regional Energy • Gas production: 30.8 billion m3 in ’09, down 5.6% from ’08 • Oil production: 3.2 million m3 in ’09, down 5.3% from ’08
Regional Energy • 1,189 wells spudded in ’09; down 52% from ’08 • 16.4% of # of Alberta spuds
US Shale Gas Cause of Weak Gas Prices Source: U.S. Energy Information Administration
Number of Businesses by Employee Size Source: Statistics Canada’s Business Register
Number of Businesses by Industry PSTS: Professional, Scientific and Technical Services FIRE: Finance, Insurance and Real Estate Source: Statistics Canada’s Business Register
Accommodation Sector • Region had 84 accommodation properties with 4,500 rooms • Average occupancy rate in the region was 47% • Average room rate was $90
Personal Income Source: Alberta Finance & Enterprise • Average individual income: $34,500 in ’07; #6 of 14 regions • Income grew 42% ’03 – ’07; #5 of 14
Consumer Prices • Regional price levels are lower than the Edmonton benchmark level • Shelter costs are also lower than in Edmonton
Investment • CA housing starts: 1,076 in ’10 up from 1,055 in ’09 • Housing units: 1,594 in ’09; down 36% from ’08 Source: Statistics Canada and CMHC
Building Permits • Building Permits: $442 million in ’09; down 45%
Conclusions • World economy has emerged from recession • Outlook is for slightly weaker growth in ’11 – many risks • US economy needs to gradually unwind stimulus • Alberta expected to see return to strong growth over medium term • Oil prices at high levels, but gas prices are weak • Rising US shale gas production is a threat • Forestry prices are improving; strong agricultural prices • Livestock inventories continue to decline (COOL) • May need to look at other foreign markets for forest and agricultural products, e.g. Asia • Weak US $ is a threat