Download
1 / 16
160 likes | 321 Views
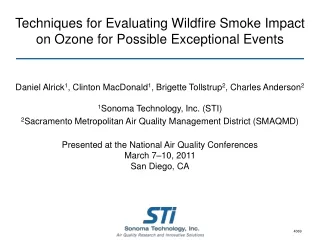
Techniques for Evaluating Wildfire Smoke Impact on Ozone for Possible Exceptional Events. Daniel Alrick 1 , Clinton MacDonald 1 , Brigette Tollstrup 2 , Charles Anderson 2 1 Sonoma Technology, Inc. (STI) 2 Sacramento Metropolitan Air Quality Management District (SMAQMD)

E N D
Techniques for Evaluating Wildfire Smoke Impacton Ozone for Possible Exceptional Events Daniel Alrick1, Clinton MacDonald1, Brigette Tollstrup2, Charles Anderson2 1Sonoma Technology, Inc. (STI) 2Sacramento Metropolitan Air Quality Management District (SMAQMD) Presented at the National Air Quality Conferences March 7–10, 2011 San Diego, CA 4069
What are Exceptional Events? “Unusual or naturally occurring events that can affect air quality but are not reasonably preventable...”
What Makes an Event Exceptional? • To justify data exclusion, evidence must show that • “There is a clear causalrelationship between the measurement under consideration and the event that is claimed to have affected the air quality in the area.” • “The event is associated with a measured concentration in excess of normal historical fluctuations, including background.” • “There would have been no exceedance or violation but for the event.” • The “but for” clause is often the most difficult to satisfy • No one data set necessarily has all the information • Availability and use of good meteorological data and analysis tools is critical
Basin Complex 2008 Northern California Wildfires, Summer 2008 Smoke on July 11, 2008
Northern California Wildfires, Summer 2008 Drought, Lightning, and Fires Below average precipitation across California during February through June 2008 Fires started by lightning in June 2008 Lightning strikes: more than 6,000 from June 20 to 21, 2008
Wildfire Impact on Air Quality • Wildfire smoke contains VOCs, NOx, and PM • During wildfires, several ozone exceedances occurred in the Sacramento area
Tools for Evaluating Impact of Smoke • Conceptual model • Examination of local meteorological conditions on days with high ozone concentrations • Identification of matching days • Regression analysis • Equations describing the relationship between pollutant concentrations and meteorological parameters Ozone = (Temp) ∙m1 + (Wind Speed) ∙m2 + ... + constant
Conceptual Model (1 of 4) • Describes meteorological conditions typical of high ozone levels • Using surface and upper air observations, STI developed rules of thumb for high ozone levels in Sacramento
Conceptual Model (2 of 4) Did weather conditions meet the rules of thumb for high ozone levels?
Conceptual Model (3 of 4) • Primary pattern for high ozone levels is an upper-level ridge over the West Coast • Surface thermal trough over Sacramento
Conceptual Model (4 of 4) Did the weather pattern fit with the conceptual model? • Zonal upper flow across northern California – does not fit with conceptual model • Surface thermal trough located near Sacramento
Identification of Matching Days (1 of 2) Compare days with and without smoke that have similar meteorological conditions and look at the difference in ozone concentrations. SmokeDay Matching Day Example of a relatively good match of upper-level patterns between smoke day and matching day.
Identification of Matching Days (2 of 2) Result: Ozone concentrations are higher on smoke day compared to matching day.
Regression Tools (1 of 2) • Developed using historical ozone observations (daily 1-hr maximum ozone) • Compare model predictions to observed ozone concentrations on smoke days Observation – Max. Prediction = Estimated Smoke Contribution
Consider Regression Model Error (2 of 2) Example for one model: Error (Model – Obs) • In model development, calculated error range on regression predictions for the entire data set • Estimated smoke contribution to ozone ranged from 48 to 85 ppb on the four example smoke days Error on most days (95%) was ±35 ppb
Conclusion Existing and proven forecasting tools can be useful in determining smoke impact on air quality.