Download
1 / 20
200 likes | 297 Views
Formal Biology of the Cell Locations, Transport and Signaling François Fages, Constraint Programming Group, INRIA Rocquencourt mailto:Francois.Fages@inria.fr http://contraintes.inria.fr/. Overview of the Lectures. Introduction. Formal molecules and reactions in BIOCHAM.

E N D
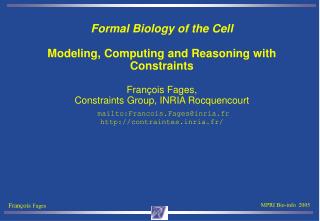
Formal Biology of the Cell Locations, Transport and SignalingFrançois Fages, Constraint Programming Group, INRIA Rocquencourtmailto:Francois.Fages@inria.frhttp://contraintes.inria.fr/
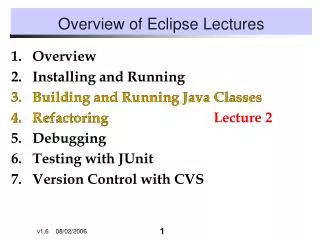
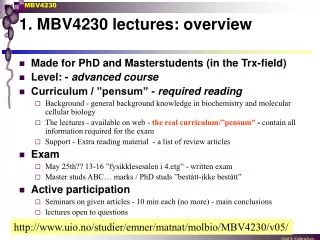
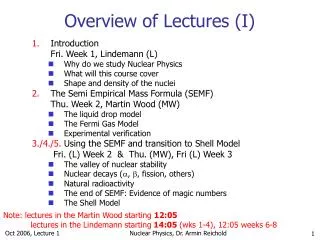
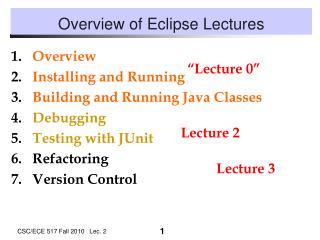
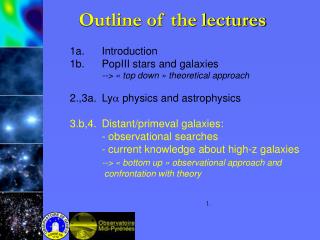
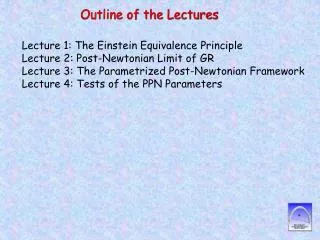
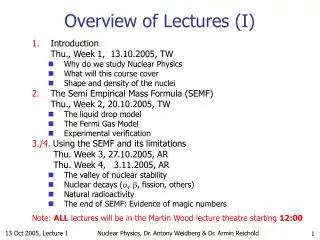
Overview of the Lectures • Introduction. Formal molecules and reactions in BIOCHAM. • Formal biological properties in temporal logic. Symbolic model-checking. • Continuous dynamics. Kinetics models. • Computational models of the cell cycle control [L. Calzone]. • Mixed models of the cell cycle and the circadian cycle [L. Calzone]. • Machine learning reaction rules from temporal properties. • Learning kinetic parameter values. Constraint-based model checking. • Protein structure prediction with Constraint Logic Programming. • Locations, transport and signaling.
Symbolic Locations in BIOCHAM • Locations are symbolic notations used for representing mainly • Cell compartments: nucleus, cytoplasm, membrane, … • Tissues of cells: C1, C2, … • Solution S == _ | O+S • Object O == E | E::location • Element E == name | E-E | E~{p1,…,pn} • Declaring the set of possible locations for an element • localize p53::[cytoplasm, nucleus]. • defines all localized forms: p53, p53::cytoplasm, p53::nucleus
Transport Rules • A::L1 => A::L2 • Cdk1~{p}-CycB::cytoplasm => Cdk1~{p}-CycB::nucleus. • A~{p}::L1 => A::L2 • Mdm-Mdm~{p}::cytoplasm => Mdm-Mdm::nucleus. • localise Mdm-Mdm::[c,n]. • localise Mdm-Mdm~{p}::c. • volume_ratio (15,n),(1,c). meaning 15*Vn = 1*Vc • (0.5*[Mdm-Mdm::n],15*[Mdm-Mdm~{p}::c]) for • Mdm-Mdm::n <=> Mdm-Mdm~{p}::c. • shorthand for 15*Mdm-Mdm::n <=> Mdm-Mdm~{p}::c.
Volume Ratios for the Concentration Semantics • A set of BIOCHAM reaction rules • {ei for Si => S’i | i=1,…,n} • is interpreted in the concentration semantics by the system of ODEs: • dxk/dt = ΣXi=1n ri(xk) * ei − ΣXj=1n lj(xk) * ej • where ri (resp. lj) is the stochiometric coefficient of xk in S’i (resp. Si) multiplied by the volume ratio of the location of xk.
Example: DNA Repair Control by p53/mdm2 • Vogelstein et al. 2000
Observed p53/mdm2 Oscillations after Irradiation • Damped oscillations after strong irradiation • Delay and no oscillations • after weak irradiationLev Bar-Or et al. (2000)
Single Cell Behaviors • « Analogic » • « Digital » • From Lahav et al. (2004) Geva-Zatorsky et al. (2006)
Effect of Ionizing Radiation (IR) on DNA • Irradiation: • 0.2*[IR] for IR => _. • DNA damage: • 0.18*[IR] for _ =[IR]=> damaged_dna. • DNA repair: • 0.017*([p53]+[p53-u]+[p53-u-u]) • *[damaged_dna]/(1+[damaged_dna]) for • damaged_dna => dna.
Interaction and Influence Schemas • Ciliberto et al. 2005 • Kaufman et al. 2006
Synthesis and Degradation of p53 • (0.055, 0.0055*[p53]) for _<=> p53. • P53 degradation is accelerated by Mdm2::n through ubiquitination • 8.8 *[p53]*[Mdm-Mdm::n] for p53 =[Mdm-Mdm::n]=> p53-u. • 2.5*[p53-u] for p53-u => p53. • 0.0055*[p53-u] for p53-u => _. • 8.8*[p53-u]*[Mdm-Mdm::n] for • p53-u =[Mdm-Mdm::n]=> p53-u-u. • 2.5*[p53-u-u] for p53-u-u => p53-u. • 8.0055*[p53-u-u] for p53-u-u => _.
Synthesis and Degradation of Mdm2 in the Cytoplasm • P53 promotes the transcription of Mdm2 • 0.0015+0.006/(1.2^3/(([p53]+[p53-u]+[p53-u-u])^3)) • _ =[p53]=> Mdm-Mdm::c. • 0.05*[Mdm-Mdm::c]/(0.01+[p53]+[p53-u]+[p53-u-u]) for • Mdm-Mdm::c => Mdm-Mdm~{p}::c. • 6*[Mdm-Mdm~{p}::c] for Mdm-Mdm~{p}::c => Mdm-Mdm::c. • 0.01*[Mdm-Mdm~{p}::c] for Mdm-Mdm~{p}::c => _. • 0.01*[Mdm-Mdm::c] for Mdm-Mdm::c => _.
Transport and Degradation of mdm2 in the Nucleus • (14*[Mdm-Mdm~{p}::c], 0.5*[Mdm-Mdm::n]) for • Mdm-Mdm~{p}::c <=> Mdm-Mdm::n. • 0.01*[Mdm-Mdm::n] for Mdm-Mdm::n => _. • DNA damage accelerates the degradation of Mdm2::n by auto-ubiquitination (ATM and ATR kinases) • 0.01*[damaged_dna]*[Mdm-Mdm::n]/(0.2+[damaged_dna]) for • Mdm-Mdm::n =[damaged_dna]=> _.
Simulation of Irradiation and DNA Repair • p53/mdm2 model of Ciliberto et al. 2005
Cell Differentiation by Delta-Notch Signaling • Xenopus embryonic skin [Ghosh, Tomlin 2001]
Delta-Notch Lateral Signaling • Delta and Notch proteins are transmembrane proteins • Delta acts as a ligand and Notch as a receptor • Notch production is triggered by high Delta levels in neigboring cells • Delta production is triggered by low Notch concentration in the same cell • Notch and Delta are degraded. • At the steady state, a cell has either the Delta phenotype or the Notch
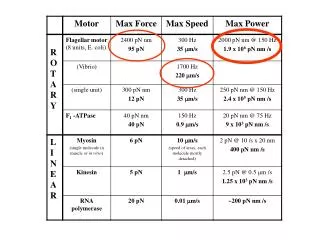
Four Possible States • Delta expressed and Notch inhibited Vd=0.2 Vn=0.5 • D>Vd N<Vn • Delta and Notch expressed • D>Vd N>Vn • Delta inhibited and Notch expressed • D<Vd N>Vn • Delta and Notch inhibited • D<Vd N<Vn
Delta-Notch on a Loop of 20 Cells • localise D::[c1,c2,c3,c4,…,c20]. • localise N::[c1,c2,c3,c4,…,c20]. • Delta production and degradation for all cells • if [N::c1]>0.5 then (-[D::c1]) else (1-[D::c1]) for_ => D::c1. • Notch production and degradation for a one neighbor cell • if [D::c2]<0.2 then (-[N::c1]) else (1-[N::c1]) for • _ => N::c1. • Notch production and degradation for a two neighbors cell • if [D::c1]+[D::c3]<0.2 then (-[N::c2]) • else (1-[N::c2]) for _ => N::c2.
Delta-Notch on a Square Grid of 36 Cells • Delta production and degradation for all cells • if [N::c1]>0.5 then (-[D::c1]) else (1-[D::c1]) for_ => D::c1. • Notch production and degradation for a four neighbors cell • if [D::c21]+[D::c23]+[D::c12]+[D::c32]<0.2 • then (-[N::c22]) • else (1-[N::c22]) • for _ => N::c22.