Download
1 / 20
200 likes | 361 Views
Thinning intensity studies and growth modeling of Montana mixed conifer forests at the University of Montana’s Lubrecht Experimental Forest. Thomas Perry Research Forester Applied Forest Management Program College of Forestry and Conservation University of Montana Missoula, MT.

E N D
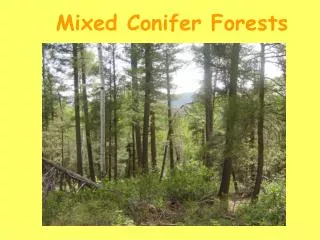
Thinning intensity studies and growth modeling of Montana mixed conifer forests at the University of Montana’s Lubrecht Experimental Forest Thomas Perry Research Forester Applied Forest Management Program College of Forestry and Conservation University of Montana Missoula, MT
Applied Forest Management Program http://www.cfc.umt.edu/AFMP/default.php Developing and promoting silvicultural tools and techniques for the restoration and renewal of western forests.
Lubrecht Experimental Forest ▪ Timber ▪ Education ▪ Research ▪ Recreation ▪
The Landbase Pre-acquisition period: pre-1937. • Owned by Anaconda Timber Company. • Explotive harvesting; stand re-generating disturbance. Early Lubrecht Years: 1938-1960’s. • Focus on managing uncontrolled grazing • Small thinning studies established Timber Management Era Begins: 1960’s. • Road building increases • Clearcutting implemented; Greenough Ridge, Stinkwater Creek, Old Coloma Road. Transition to Stand Tending: 1970’s. • Timber sales primarily salvage, thinning and some overstory removal. Stand Tending Period: 1980’s-2000’s • Diameter in many stands is large enough for viable commercial thinning. Large scale thinning program implemented. • Viable pulp markets encourage continued thinning through 1980’s and 1990’s. Pine Beetle Salvage: 2000’s to present • MPB salvage operations account for more and more harvest volume. • 1100m-1900m • (3630ft-6270ft) • 8500ha • (21,000 acres) • Douglas fir (Psme) • Ponderosa pine (Pipo) • Western larch (Laoc) • Lodgepole pine (Pico)
The Levels of Growing Stock Thinning Network (LOGS) • History • Established in 1983, measured at 5 year intervals until 2003, then six years elapsed until the 6th measurement • Intent • Establish permanent growth and yield plots for a range of sites, species, and stand densities. • Compare several alternative stand density measures computed for the same stands. • Evaluate multi-resource productivity in side by side comparison (timber, range, wildlife, watershed, recreation). • Implementation • 6 sites • 4 thinning levels (treatment) per site • 3-7 plots per treatment
3 Age Groups 3 Habitat Types 5 Composition classes LOGS
Study Design Summary • 6 Installations • Varied Site Conditions • Age • Site • Composition • No Replication • No Randomization • Design will not facillitate statistically robust comparisons between treatments.
Data Set 3137 individual trees, measured 2-6 times since 1983, 12548 records.
Analysis - Data Set Goals • Diameter growth model • H:D model • Volume growth model • Compare with FVS growth predictions for local stands. Diameter Growth Model
Modeling Process- Overview • Stepwise process • Predicting diameter • Previous diameter • Density measures • Species effects • Species specific models • Linear modeling in R DBH t-1 DBH t-1 + TPH t-1 DBH = DBH t-1 + BA t-1 DBH t-1 + BA t-1 + Sp
Time series of basal area; level 1 Time series of basal area; level 2 Time series of basal area; level 3 Time series of basal area; level 4
Competition and Growth Competition (Basal Area/hectare) Growth (Annual Increment [cm]) Treatment Treatment Thinning Intensity Thinning Intensity
Variables-Why Drop Treatment ? • Treatment tried to create 4 levels of thinning intensity and residual density. • Thinning intensity, residual density, and species composition varied too much for distinctions by treatment to be meaningful. • A better option was to use actual density per plot to describe competition for individual trees. • Use a measured variable rather than a categorical variable that did not adequately reflect stand conditions.
Variables-Density • Trees per Hectare versus Basal Area • Expected stronger correlation using BA • Better measure of competition than TPH since same levels of TPH could have wide ranges of competitive stress based on QMD
Wrap Up How useful is a diameter based model predicting a fixed growth period? While not biologically valid, will it perform across a local landscape? For the increment model – What could be done to account for more of the variability in the model? Will increased site and stand factors limit the portability of this model? Is the dataset powerful but not useful or is it a diamond in the rough? What would you do with this data? • Good fit with diameter based model. • Utilizes 80% of data set. • Strong autocorrelation. • Increment model is less autocorrelated. • Utilizes 100% of data set. • Weak fit without good data describing environmental and morphological parameters.
Acknowledgements • Dr. David Affleck: University of Montana • Dr. Aaron Weiskittel: Universisty of Maine • Dr. Chris Keyes: University of Montana • Kevin Barnett: University of Montana • Woongsoon Jang: University of Montana