Download
1 / 13
130 likes | 255 Views
Onset and End of the Rainy Season in South America in Observations and the ECHAM 4.5 Atmospheric General Circulation Model. Compare Observed Precipitation with that from 24 member average of ECHAM 4.5 Atmospheric Model 1976-2001 Observations and model at same resolution ~ 2.8° x 2.8°

E N D
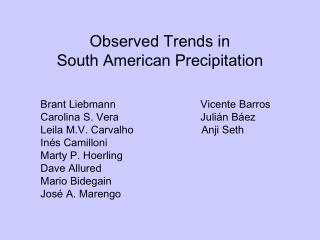
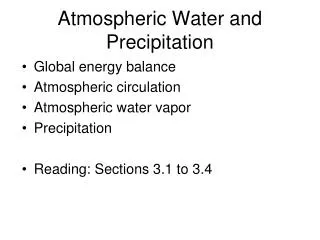
Onset and End of the Rainy Season in South America in Observations and the ECHAM 4.5 Atmospheric General Circulation Model Compare Observed Precipitation with that from 24 member average of ECHAM 4.5 Atmospheric Model 1976-2001 Observations and model at same resolution ~ 2.8° x 2.8° Model: T42 horizontal; 19 vertical Brant Liebmann Suzana J. Camargo Anji Seth Jose A. Marengo Leila M.V. Carvalho Dave Allured Rong Fu Carolina S. Vera
Data We wish to thank the following agencies for providing the data used in this study: Agência Nacional de Águas (Brasil) Agência Nacional Energia Elétrica (Brasil) U.T.E. Uruguay C.T.M. Salto Grande Servicio Meteorologico Nacional (Argentina, Paraguay, Uruguay) FUNCEME (Ceará, Brasil) IAPAR - SIMEPAR (Paraná, Brasil) DAEE (São Paulo, Brasil) Minesterio del Ambiente y los Recursos Naturales (Venezuela) Meteorogische Dienst Suriname METEO-France ASANA (Bolivia)
Difference in Annual Total (model minus observations) What is the cause of the bias in annual totals?
A = ‘Anomalous Accumulation’ R = daily rainfall = Annual daily average
length start end
Average Onset Date Jul Oct Apr Jan Jun Dec Feb Mar Nov Aug Sep May
SACZ 45W, 15S
Variance of Annual Total Explained: by Wet Season Length by Wet Season Rate OBSERVATIONS
Conclusions Rainy season expands northward from southern Amazon ECHAM 4.5 in qualitative agreement with observations Bias in annual totals often results from differences in rain rate