Download
1 / 55
560 likes | 734 Views
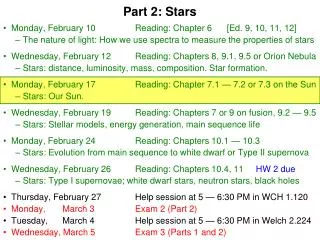
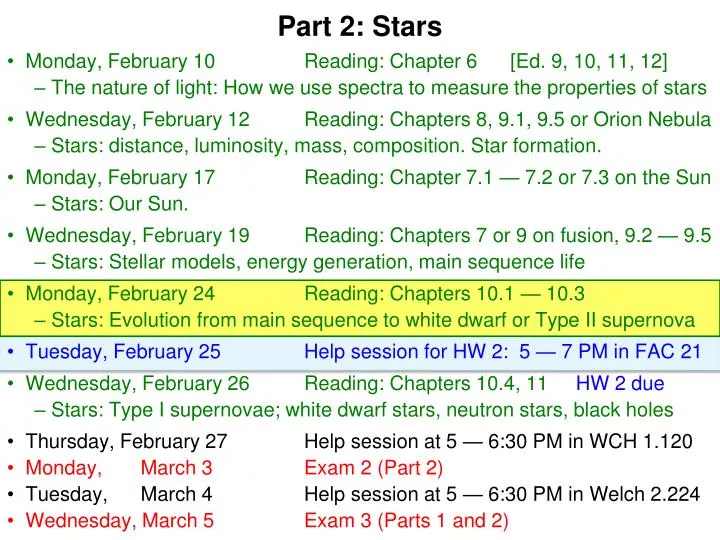
Part 2: Stars. Monday, February 10 Reading: Chapter 6 [Ed. 9, 10, 11, 12] The nature of light: How we use spectra to measure the properties of stars Wednesday, February 12 Reading: Chapters 8, 9.1, 9.5 or Orion Nebula Stars: distance, luminosity, mass, composition. Star formation.

E N D
Part 2: Stars • Monday, February 10 Reading: Chapter 6 [Ed. 9, 10, 11, 12] • The nature of light: How we use spectra to measure the properties of stars • Wednesday, February 12 Reading: Chapters 8, 9.1, 9.5 or Orion Nebula • Stars: distance, luminosity, mass, composition. Star formation. • Monday, February 17 Reading: Chapter 7.1 — 7.2 or 7.3 on the Sun • Stars: Our Sun. • Wednesday, February 19 Reading: Chapters 7 or 9 on fusion, 9.2 — 9.5 • Stars: Stellar models, energy generation, main sequence life • Monday, February 24 Reading: Chapters 10.1 — 10.3 • Stars: Evolution from main sequence to white dwarf or Type II supernova • Tuesday, February 25 Help session for HW 2: 5 — 7 PM in FAC 21 • Wednesday, February 26 Reading: Chapters 10.4, 11 HW 2 due • Stars: Type I supernovae; white dwarf stars, neutron stars, black holes • Thursday, February 27 Help session at 5 — 6:30 PM in WCH 1.120 • Monday, March 3 Exam 2 (Part 2) • Tuesday, March 4 Help session at 5 — 6:30 PM in Welch 2.224 • Wednesday, March 5 Exam 3 (Parts 1 and 2)
When Our Sun Gets Old • When the hydrogen at its center is used up, the Sun will become much brighter. • It will swell enormously. Eventually, its outer layers will be ejected into space. • Today, about half the hydrogen at the center of the Sun has been converted to helium. When all of the hydrogen at the center has been used up, the feedback mechanism that regulates the Sun’s energy output will fail. Nuclear reactions will continue to convert hydrogen to helium in a shell that surrounds the helium-rich core. The core has no energy source of its own, so will contract. Living off of gravitational energy, it will get hotter. • As the core heats up, the flow of energy from the center of the Sun increases. To handle this outpouring of energy, the outer layers expand. When the Sun is 10 billion years old, its energy output and radius will dramatically increase. The Sun will become a red giant star with a luminosity of several hundred L and a surface temperature of about 3000 K. H He He 10,000 x
The Sun as a Red Giant Star The Sun as a main sequence star (diameter ≈ 1/100 AU) The Sun as a red giant (diameter ≈ 1 AU)
Observing Stellar Evolution • Evolutionary tracks in the HR diagram: • To show how a star evolves, we plot it on an HR diagram at regular time intervals. The Sun will stay close to the main sequence for the first 10 billion years of its life. Then it will move upward and to the right as it gets brighter and cooler. • More massive stars evolve faster and leave the main sequence sooner than the Sun. 11 billion years 10 billion yr . 7 billion years main sequence Caution re: common misconception: “Moving” along an evolutionary track in the HR diagram has nothing to do with the star’s motion through space. It is just an easy-to-understand representation of how the temperature and luminosity change during a star’s life.
Observing Stellar Evolution 11 billion years 10 billion yr Evolutionary track of our Sun in the HR diagram More massive stars leave the main sequence earlier and die faster. The most massive stars live only a few million years. Cluster HR diagrams A globular star cluster contains about a million stars that orbit around the same center. They all formed at the same time, but they have a range of masses. Today, the most massive stars have already died, stars like the Sun are leaving the main sequence roughly now, and stars that are still less massive are in the prime of their lives. An HR diagram is a snapshot of the evolutionary state of a cluster. The age of the cluster is equal to the main sequence lifetime of the stars at the turnoff. . 7 billion years main sequence “turnoff” main sequence
Cluster Evolution: How To Measure Cluster Ages Young Cluster Stars here have almost run out of core H fuel and are about to leave the main sequence.
Globular Clusters • Globular clusters are distributed around the Milky Way galaxy in a great spherical halo. A typical cluster is ~ 150 light years across and contains hundreds of thousands of stars.
HR Diagram of 47 Tuc Horizontal branch
Helium Ignition • When the temperature becomes high enough, the helium in the core of a red giant star starts to undergo nuclear reactions. The reaction • 4He + 4 He 8Be 4He + 4He • does not produce energy because 8Be is unstable: it breaks up into two He nuclei. But the triple-α process does produce energy: • 4He + 8Be 12C + 7.3 million eV. • This reaction converts about 0.025% of the mass involved into energy. • In a 1 M star, the triple-α process begins when the temperature of the helium core reaches 100 million K. At first the helium burns violently, producing about 100 billion times as much power as the Sun does now. This is called the helium flash. After the flash, the helium core expands and the reaction rate drops. In about 100,000 years, the star settles down as a horizontal branch star, burning helium to carbon in its core and hydrogen to helium in a shell around the core. H He He HeC 100 x
Evolution of a 5 M Star Through Helium Fusion Helium “main sequence”
Red SupergiantsPlanetary Nebulae • When the helium in the core of a horizontal branch star is used up, the inert core of carbon must contract under its own gravity. Meanwhile, helium burns in a shell around the carbon core, and hydrogen burns in a shell around the helium core. As the central temperature increases, the energy flow from the core increases again, and the envelope of the star must expand again. Eventually it reaches a diameter of about 3 AU. • Now the star is so bloated that its gravity can no longer hold onto its outer layers. The envelope lifts off from the core and expands in all directions at 10 — 20 km/s. The core continues to emit energy, but it is so hot that most of the energy comes out as ultraviolet photons. Atoms in the expanding envelope fluoresce as they absorb these ultraviolet photons, producing a glowing shell or planetary nebulaaround the central cinder. • Planetary nebulae expand and become invisible on a timescale of about 50,000 years. H He He C 10,000 x He C
As the envelope lifts off, the stellar core is exposed.So the star looks much hotter but not much brighterbecause it also gets a lot smaller.
Evolution to a Planetary Nebula The youngest planetary nebula: Only in the last 25 years has the central star got hot enough to make the nebula shine. Size ≈ 130 Solar Systems.
Electron Degeneracy • The relentless contraction of a star leads to ever higher temperatures unless something stops the contraction. In low-mass stars, contraction is halted by a new kind of pressure. • According to quantum mechanics, the more tightly an electron is confined in space, the more freedom it has in velocity. A gas that contains loose electrons is like a fluid in a tank whose walls can move closer together. As the walls close in, the level of the fluid must rise. In this analogy, the width of the tank represents the space in which the gas is confined, and the height of the fluid represents the range of electron velocities required. • As a star shrinks, there is less space for its electrons. Therefore, some electrons must be pushed up to higher velocities. At first this does not take much energy. But as the required velocities grow, it eventually takes more energy to push the electrons to higher levels than the star can gain by contracting. Then contraction of the star is halted by electron degeneracy pressure.
White Dwarf Stars • In a star like the Sun, electron degeneracy stops the contraction of the core before the temperature gets high enough to start carbon burning. Supported against further contraction, the core cannot get any more energy by gravitational contraction. • From this point on, the core cools down like an ordinary object. While it is still hot enough to be seen, such a core is known as a white dwarf star. • Compared to other stars, white dwarfs are tiny. More remarkable is the way that the radius of a white dwarf depends on its mass. In normal main sequence stars, the radius is roughly proportional to the mass. But more massive white dwarfs are smaller! This is because more massive white dwarfs have more gravitational energy available and so can push the electrons to higher velocities before degeneracy sets in. • But according to special relativity, nothing can go faster than light. If the star is too massive, its electrons would have to move faster • than light to produce enough electron degeneracy pressure. • This is not allowed. Therefore: • There is an upper limit to the mass of a white dwarf star. • This is known as the Chandrasekhar limit: • All white dwarf stars must have masses less than 1.4 M.
More Massive Cakes Are BiggerbutMore Massive White Dwarfs Are Smaller 0.4 kg 0.8 kg 0.4 M 0.8 M
Mass-Radius Relation for White Dwarfs Radius (solar radii) Chandrasekhar limit = 1.4 M 1983 Nobel Prize for Physics
One of the Nearest White Dwarfs is the Companion of Sirius ~ 0.98 M Density ≈ 3 106 g cm-3 A teaspoon of white dwarf stuff would weigh ~ 15 tons on Earth.
Corpses of Stars White Neutron Black dwarf star hole Progenitor star mass: 0.08 — 8 M 8 — 20 M > 20 M Corpse mass: ≤ 1.4 M ≤ 3 M 3 — 10 M Corpse radius: 7000 km ~ 10 km ~ 10 km Corpse density: 106 g cm-3 1015 g cm-3 - 1 teaspoonful on Earth: 5 tons 1 billion tons - Thickness of atmosphere: ~ 50 km a few meters -
Evolution ofHigh-Mass andLow-MassStars Next lecture
Supernovae are among the grandest events in nature.
Evolution of High-Mass Stars • Stars born with more then 8 — 10 M cannot • lose enough mass to become white dwarfs. • These stars have another fate: core collapse. • Ignition of “metals” • The core of an old high-mass star gets little • support from electron degeneracy pressure, • so it has to contract. Its temperature climbs • to several billion K. Then nuclear reactions • convert elements from carbon through silicon • into iron. These late stages of nuclear burning • produce relatively little energy and delay the • end only briefly. • Formation of an iron core • Near the end, a high-mass star has an iron core supported by electron degeneracy pressure. No more nuclear energy is available. As its mass approaches 1.4 M , the core becomes ever smaller and hotter.
Even without nuclear reactions, • Stars get hotter inside as they radiate! • Radiation reduces T temporarily. This reduces the pressure. • So the star contracts. • This converts gravitational energy into heat. It is not intuitively obvious, but exactly half of the gravitational energy goes into internal heat, and the other half is radiated away. • So the center of the star gets hotter. Stellar evolution is this inexorable contraction interrupted by periods of nuclear “burning.”
Nuclear Reactions in a 15-M Star As T rises to 100 million K in the core, He Be Carbon; As T rises to and above 600 million K, Carbon Oxygen,Neon, Magnesium Silicon, Sulfur, …; As T rises above 3 billion K, Sulfur Iron. An iron core develops, surrounded by shells of lighter elements, each with nuclear reactions burning outward at its surface. The iron core is inert. No more energy can be derived from it by nuclear reactions.
Evolutionary Stages of a 25-M Star • Stage Central temperature Central density Duration • (K) (kg/m3) of stage • Hydrogen burning 4. 107 4 103 7 106 years • Helium burning 2. 108 7 105 5 105 years • Carbon burning 6. 108 2 108 600years • Neon burning 1.2 109 4 109 1 year • Oxygen burning 1.5 109 1 1010 6 months • Silicon* burning 2.7 109 3 1010 1 day • *more than a solar mass! • Result: a slowly contracting iron core in which T steadily increases. • But iron is the most stable nucleus. • There is no more energy to be gained by nuclear reactions.
The contracting iron core has no further • energy source via nuclear reactions. • So the central temperature rises. • At about 10 billion K, • photons that hit an iron nucleus smash it to pieces. • But the pieces are less tightly bound than iron. • So this uses up energy. • In other words, this uses up heat. • The iron core is suddenly refrigerated. Pressure disappears. • The core collapses in less than a second.
Evolutionary Stages of a 25-M Star • Stage Central temperature Central density Duration • (K) (kg/m3) of stage • Hydrogen burning 4. 107 4 103 7 106 years • Helium burning 2. 108 7 105 5 105 years • Carbon burning 6. 108 2 108 600years • Neon burning 1.2 109 4 109 1 year • Oxygen burning 1.5 109 1 1010 6 months • Silicon* burning 2.7 109 3 1010 1 day • Core collapse 5.4 109 3 1012 0.2 seconds • Core bounce 2.3 1010 4 1017 milliseconds • Explosion 109 dropping rapidly 10 seconds • *more than a solar mass!
Type II Supernova • In less time than it takes to snap your fingers, • 1046 joules come out, 99% as neutrinos. • The Sun would have to shine for ~ 800 billion years • at its present luminosity to give off 1046 joules. • At the moment of collapse, the power output of a Type II supernova is comparable to that of all the stars • in the observed Universe combined.
Evolution into a Supernova Type I Supernova (next lecture) Type II Supernova
SN 1987A Supernova 1987A was the first naked-eye supernova in 383 years. It is about 170,000 light years away in the neighboring galaxy the Large Magellanic Cloud. After the explosion faded, the above bright rings appeared. The inner ring is believed to be gas ejected by the star ≥ 20,000 years ago and now lit up by the blast. The outer rings are not understood.
The Birth of Neutrino Astronomy II: Neutrinos From SN 1987A • At 7h 36m UT on 1987, February 23, • 3 hours before the supernova began to brighten in visible light: • The Japanese neutrino telescope Kamiokande II detected • a burst of 11 neutrinos • and simultaneously the • Irvine-Michigan-Brookhaven neutrino telescope detected a burst of 8 neutrinos. • Both bursts came from the direction of the Large Magellanic Cloud. • Therefore we observed the core collapse of the • 20 M precursor star Sanduleak -69°202 (B3 Ia supergiant) directly, • 3 hours before the shock wave from the blast reached • the surface of the star and started to make it brighten. • The time delay is as expected. • The implied total neutrino flux of 10 billion / cm2 is also • as expected for a Type II SN at 170,000ly.
SN 1987A False-color HST image of the gas ring around SN 1987A. Diameter = 1.37 ly. This gas was ejected 400,000 — 20,000 years ago and is now being illuminated by the supernova explosion. Cluster of photons from one of 8 neutrinos from SN 1987A detected by Irvine/Michigan/Brookhaven neutrino observatory.
Raymond Davis (left) and Masatoshi Koshiba (head of the Kamiokande team that detected neutrinos from Supernova 1987A) won the 2002 Nobel Prize in Physics. See: http://www.nobel.se/physics/laureates/2002/
Supernova Light Curves • When a Type II supernova first becomes visible, the temperature of the expanding cloud of debris is so high that most radiation is emitted as ultraviolet light.As the cloud expands, its temperature drops. One week after the explosion, the temperature has fallen to 6000 K and the cloud radiates mostly visible light.The temperature stays at this level for weeks as ionized atoms recombine with electrons. • After recombination, the gas is not hot enough to be luminous on its own. Now radioactive decay provides a heat source. Both Type I and Type II supernovae produce large amounts of radioactive 56Co (cobalt), which decays to iron with a half-life of 77 days. The luminosity of the supernova remnant decreases at just the rate expected for 56Co decay. • Later, radioactive elements have decayed away and no longer heat the remnant. Then, as the debris cloud expands, it runs into the tenuous gas between stars. The resulting shock waves heat the gas, making it glow faintly in visible light. Our galaxy is littered with expanding shells of supernova remnants.