Download
1 / 17
170 likes | 287 Views
Why Do We Need More Genotypes and Phenotypes?. How Much Data, and What Cost?. Traditional data sources 55 million pedigree records 28 million US cows with lactations 57 million daughters of MACE bulls Current and future data sources 50K genotypes on 50,119 animals

E N D
How Much Data, and What Cost? • Traditional data sources • 55 million pedigree records • 28 million US cows with lactations • 57 million daughters of MACE bulls • Current and future data sources • 50K genotypes on 50,119 animals • 3K, 850K, etc. genotypes • Additional traits, more herds
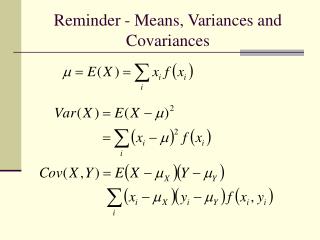
Value of Phenotypes • Contribution = ∑ (REL – Rpa) • 10,000 HO bulls, 77% REL, 40% Rpa • 8,000 HO cows, 46% REL, 36% Rpa • Cows supply 18% of genomic info • Recent phenotypes slightly more valuable than past generations • Foreign useful if correlations high • CAN HO, CHE BS, DNK JE, etc.
Genotyped Animals (n=42,653)In North America as of February 2010
Validation Results • EuroGenomics reliabilities about 5% higher than in North America • Plan to be official in August 2010 • > 10% REL gain from exchange • Similar regressions, slightly < 1.0 • Validation expects regressions < 1 with selective genotyping of bulls • Means of genotyped vs. nongenotyped • Most countries genotyped all recent bulls
Genomic Validation Tests • Predict 2010 daughter data using 2006 PA or genomic PTA • DYD2010 = apa + bpa PA2006 + e • DYD2010 = apta + bpta PTA2006 + e • Statistics from Jorjani, 2010 Interbull Genomics Workshop • Foreign average includes DEU, FRA, NLD, DFS, JPN, POL, NZL, and CAN • FRA not latest data (10,000 bulls)
Regressions and Gains in R2When predicting last 4 years of data
Reliability from Additional Data Or, Or, 7,500 N. American bulls = 1500 / year over next 5 years
Foreign Genotypes • “A potentially related issue is bartering for genotypes from other countries. If you will be sharing genotypes eventually, it would be advantageous to get genotypes on their bulls in return, particularly soon.” G.R. Wiggans, July 2008 • “We are unanimously opposed to this idea.” CDDR Steering Committee, Oct 2008
REL using Only 3K, 50K, or 850Kwith increasing numbers of bulls
Expected REL with Haplotyping • Actual 3K subset of 50K genotypes • Correlation (50K, 3K) was .95 to .97 • REL PA = 35% , 3K = 63% , 50K = 70% • Simulated 500K genotypes • REL, all animals 50K = 82.6%, 500K = 84% • REL improved only if >4,000 had 500K • Gains in reliability above PA • 3K chip gives >80% of 50K REL gain • 50K chip gives >96% of 500K REL gain
Compare Young, Proven Bulls in 2006 • Bulls ranked by 2006 Net Merit • Computed from August 2006 data • Cow adjustments not included • Genomic PTAs on ftp since Nov 2009: • ftp://aipl.arsusda.gov/pub/outgoing/validation0608.zip • Base adjusted using: (NM – 132) * 1.13
Conclusions • Genomic PTAs are improving • New haplotyping program allows mixing 3K, 50K, and 850K SNPs • Foreign data free if you trade • Benefits of additional phenotypes are shared by all breeders. Should costs also be shared?