Download
1 / 32
340 likes | 637 Views
Water Cost of Service and Rate Design Kerry A. Heid, P.E. Utility Law Section of the Indiana State Bar Association 2010 Spring Seminar April 9, 2010. Ratemaking Overview. COST OF SERVICE STUDY (COST ALLOCATION). Overview of Cost of Service Study (“COSS”) and Rate Design.

E N D
Water Cost of Service and Rate DesignKerry A. Heid, P.E. Utility Law Section of the Indiana State Bar Association 2010 Spring Seminar April 9, 2010
COST OF SERVICE STUDY (COST ALLOCATION)
Overview of Cost of Service Study (“COSS”) and Rate Design • A COSS allocates the utility revenue requirements (costs) to customer classes. • Rates are then developed that recover the allocated customer class revenues to the extent practicable.
Water Cost of Service Authority • AWWA “Principles of Water Rates, Fees, and Charges” (M1 Manual, 5th Edition). • AWWA M1 Manual has been accepted by courts and public utility commissions. • AWWA M1 Manual required by IURC’s MSFRs.
M1 Manual Update • AWWA Rates and Charges Committee is responsible for M1 Manual • First began discussing need for update in 2004 • Subcommittees established in 2005 • Drafting – 2006-2009 • Chapter reviews and redrafting – 2010 • Anticipate final publication in 2011
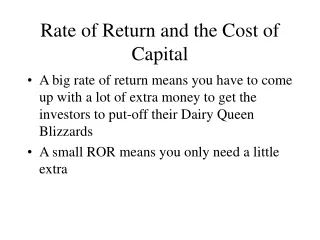
Capacity (Demand) Costs • Comprises vast majority of costs. • Most problematic to quantify. • Customer classes with high peak rates of use as compared to their average rates of use require larger capacity pumps, mains and other system facilities. • Therefore, it is appropriate that each customer class pay a different rate.
Effect of Peak Day Demand on Costs (cont.) • Despite their equal annual usage, Customer B requires significantly greater capacity of facilities than Customer A. • Therefore, Customer B should pay a higher rate than Customer A.
How to Measure Relative Capacity Use? Capacity Factors • Maximum rates of use for each customer class are expressed in terms of Capacity Factors. • Defined as percentage of customer class maximum rate of use (daily or hourly) compared to average annual rate of use. • Example: If a customer class Maximum Day rate of use is 2 times its average annual rate of use, its Maximum Day Capacity Factor is 200%.
Capacity Factors (cont.) • Each customer classes’ relative maximum day and maximum hour rates of use (Capacity Factors) serve as the basis for allocating capacity costs to customer classes, respectively. • Rationale is that customer classes with high peak rates of use as compared to their average rates of use require larger capacity pumps, mains and other system facilities.
Capacity Factors (cont.) • Generally speaking, the higher the capacity factor, the higher the rate. • In our example, Customer B has a higher Capacity Factor than Customer A, so Customer B will receive a greater allocation of capacity costs and will have a higher rate.
Criteria for Utility Rate Structures • Adequate revenue generation • Revenue stability • Promotion of efficient use (the sending of a conservation signal) • Avoidance of undue discrimination • Simplicity, easy of understanding, and public acceptance
Rate Structure - General • A water rate structure normally consists of two components: • A Service Charge or Minimum Bill for the lowest consumption levels to recover fixed, customer-related costs. • A charge that varies with the volume consumed (volumetric charge).
Rate Design Steps • First, determine Service Charge or Minimum Bill levels and revenues. • Then, design volumetric rates to recover remaining amount of target customer class revenues.
Customer Class Unit Cost • Residential Unit Cost: $2.70 per Ccf • Commercial Unit Cost: $2.40 per Ccf • Industrial Unit Cost: $1.80 per Ccf While we could have three separate rate schedules – one for each customer class, historically the rates have been combined into a single rate schedule.
Implications of Declining Block Rate Schedule • Declining block rate schedules ARE cost based. • If properly designed, declining block rate schedules do NOT reflect quantity discounts – although they have sometimes been used for this purpose. • Declining block rate schedules do not encourage wasteful consumption. • Conservation price signal can be improved.
Conservation Pricing Drivers • Growing dissatisfaction with declining block rates based on “belief that the quantity discounts offered by such rate structures are unfair.” • Growth in many communities is causing water use to exceed the safe yield of supplies and infrastructure. • Dry or drought conditions dictate some type of water rationing.
Conservation Pricing Drivers (cont.) • Growing recognition that controlling demand (demand side resources) is a viable alternative to adding capacity to meet demands (supply side resources). • Thus, communities facing water shortages are considering new rate structures that provide a financial incentive to save.
Types of Conservation Rates • Uniform Rates • Inclining (Increasing) Block Rates • Seasonal Rates • Excess Use Rates • Combinations
Inverted (Inclining) Rates • Inverted (Inclining) rates exacerbate the effect of the uniform rate example. • Combination of customer class-specific rates combined with uniform rates or inverted (inclining) rates may be a reasonable compromise.
Utility Revenue Effects from Conservation Pricing • Conservation pricing will reduce water usage, but… • Currently no consensus as to whether water conservation pricing will have a positive or negative benefit on utility revenues.
Conclusion • Please contact me with any questions.Kerry A. Heid 3212 Brookfield Drive Newburgh, IN 47630 kaheid@wowway.com Office (812) 858-0508 Cell (812) 568-5955