Download
1 / 7
70 likes | 173 Views
Characterization of the Post-Launch Line Spread Function of COS. Parviz Ghavamian A. Aloisi, C. Proffitt, D. Lennon, G. Hartig, G. Kriss, C. Oliveira, D. Massa, T. Keyes (STScI) T. Delker (Ball Aerospace) S. Osterman (Colorado). The COS LSF: Ground Tests. Gaussian 6.5 pixels FWHM.

E N D
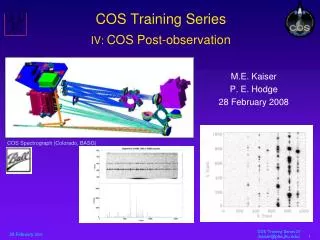
Characterization of the Post-Launch Line Spread Function of COS Parviz Ghavamian A. Aloisi, C. Proffitt, D. Lennon, G. Hartig, G. Kriss, C. Oliveira, D. Massa, T. Keyes (STScI) T. Delker (Ball Aerospace) S. Osterman (Colorado)
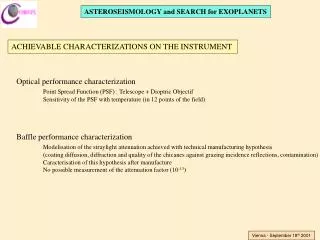
The COS LSF: Ground Tests Gaussian 6.5 pixels FWHM • During TV03/TV06, light from PtNe lamp was passed into COS after passing through RAS/Cal stimulus, which mimicked low-frequency errors from HST OTA (spherical aberration, astigmatism, coma...) • COS gratings correct for these LFEs, designed to produce R ~ 20,000 across 80% of bandpass in the resulting M-mode spectra (FUV and NUV) • The LSF profile in the FUV was well described by Gaussian shape during TV03/TV06 • In NUV, LSF profile has non-Gaussian wings due to MAMA detector response; optical models give FWHM ~ 2.5 pixels
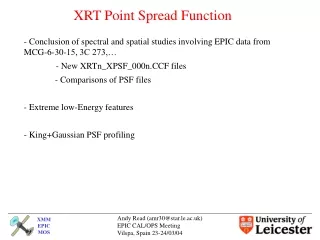
Fraction of flux falling outside of FWHM COS/NUV Model LSF: Mid-Frequency WFEs included 3 Krist & Burrows (1995) COS LSF: Effect of Mid-Frequency Errors • During SMOV, the shape of the on-orbit COS LSF was found to differ from the profile in ground testing, due to the presence of zonal (polishing) errors on primary and secondary HST mirrors • Zonal errors introduce mid-frequency errors (~18 nm) into beam entering COS; not included in RAS/Cal testing • Result is a lowered, broadened core and broad non-Gaussian wings on LSF • Mid-freq. WFEs are strongest at shortest wavelengths of COS (~1150 Å), dimin-ishing with increasing wavelength, and becoming negligible beyond ~ 2500 Å
Example: Impact of Mid-Frequency Errors on Spectra • FUV: Sk 155 in the SMC (O9 Ib, V=12.4), observed during SMOV with G130M, G160M gratings • E140H STIS echelle spectra exist (R ~ 114,000; E0.2x0.09) on archive and as part of Cycle 17 calibration data • Wings on LSF cause: • Significant filling-in of saturated absorption features • Merging of narrow absorption lines into wings of nearby saturated absorption features • Model the COS spectrum by convolving STIS E140H spectrum with model LSFs
dotted: with WFEs solid: no WFEs Impact on COS Science 3σ Limiting Equivalent Widths (assumes S/N=10 pixel-1 in continuum) • Programs using full resolution of FUV G130M, G160M and NUV G185M: • Close together lines harder to isolate • Weak, narrow absorption features (b < 35 km s-1) more difficult to detect at a given S/N; lower contrast between core and wings • Analysis of saturated absorption lines will require full consideration of LSF • Programs minimally affected are: • Those observing broad lines (b > 35 km s-1) • SED and continuum flux measurements • G140L observations, since they typically are done for SED measurements, or to observe sources with line widths larger than instrumental resolution Rough calculation; result may be improved with flux-weighted extraction, etc.
http://www.stsci.edu/hst/cos/performance/spectral_resolution