Download

1 / 19
200 likes | 364 Views
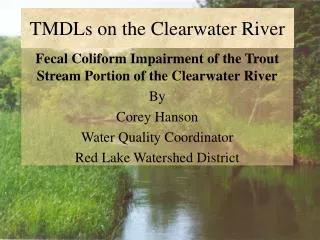
TMDLs on the Clearwater River. Fecal Coliform Impairment of the Trout Stream Portion of the Clearwater River By Corey Hanson Water Quality Coordinator Red Lake Watershed District. Explanation of Impairment.

E N D
TMDLs on the Clearwater River Fecal Coliform Impairment of the Trout Stream Portion of the Clearwater River By Corey Hanson Water Quality Coordinator Red Lake Watershed District
Explanation of Impairment • The trout stream reach of the Clearwater River is listed as impaired for fecal coliform.
Land Use • 32% Forest • 27% Grass/Pasture • 19% Ag • 11% Water/Wetland • 8% Urban/Rural Development • 3% Other
Physical Characteristics • The gradient and velocity of the stream increase prior to the trout stream reach. • Fecal coliform suitability decreases. Upstream of the Trout Stream Reach Trout Stream Reach
Possible Sources of Fecal Coliform Bacteria • High Probability • Overflows from Bagley Wastewater Treatment Facility (Improved in 2000 to eliminate overflows) • Stormwater from the City of Bagley (Stormwater ponds have been constructed to reduce amount of pollutants entering river) • Wildlife • Feedlots • Hydrologic Modification • Fecal Coliform deposited in calcareous fens/bogs (under investigation) • Sampling Techniques
Monitoring Conducted for use in the TMDL Study • Clearwater Nonpoint Study – 1992-93 • Clearwater Lake Water Quality Model Study • 2002 - 6 stream sites, bi-weekly monitoring • RLWD Long Term District Monitoring • Quarterly monitoring since mid-80’s • Data entry into STORET just recently completed, not in time for 2004 303(d) list • Clearwater Soil and Water Conservation District • Intensive fecal coliform monitoring for this TMDL Project from August 2002 – October 2002 • Samples analyzed by Minnesota Department of Health, data is currently available in STORET • 2004 Fecal Coliform Monitoring
RLWD Long-term Monitoring Sites in the Clearwater L. Watershed
SWCD/MDH Monitoring Sites CR #24 (inlet) CR #22 Hwy #2 CR #2 CR #25 3-Mile Road
Methods for Determination of Impairment • From the MPCA Guidance Manual for Assessing the Quality of Minnesota Surface Waters for Determination of Impairment – 305(b) Report and 303(d) List. • Section VIII. Assessment Based on Numeric Standard for Protection of Recreation • Pollutant – Fecal Coliform • Affects swimming and other forms of recreation that involve contact with the water • Standard of 200 col./100 ml • Impairment: >10% of samples exceed standard,at least 1 month with an average > than the standard
Data used for original impairment • Clearwater Nonpoint Study Data • Impairment found at Clearwater Lake Inlet Monitoring Site • Samples taken April 1992-May 1993 • 36.84% of samples were >200col/ml • Geometric Means of 3 months were > 200col/ml • Only 1 yr of sampling • Less than 5 samples per aggregate month
Using Data Available for 2004 303(d) List • Sampling data from October 1992 – September 2002 • Recent SWCD data included, but no RLWD data • All of the sites within the trout stream reach wouldn’t go beyond the first step of assessment (<10%) • One site upstream of the trout stream reach would be considered impaired based upon MPCA guidelines – Country Road #2
Barriers to Delisting • High spikes in fecal levels on August 28, 2002 • CR#2, CR #22, and the Clearwater Lake Inlet • <10% of samples were >200 col./100 ml at sites within the listed reach (30% @ CR #2) • Aggregate monthly averages for August were >200 col./100ml for all 3 sites
Next Steps • Work with landowners to implement BMPs • Complete TMDL Report/Delisting of the reach • Published TMDL