Download
1 / 7
70 likes | 175 Views
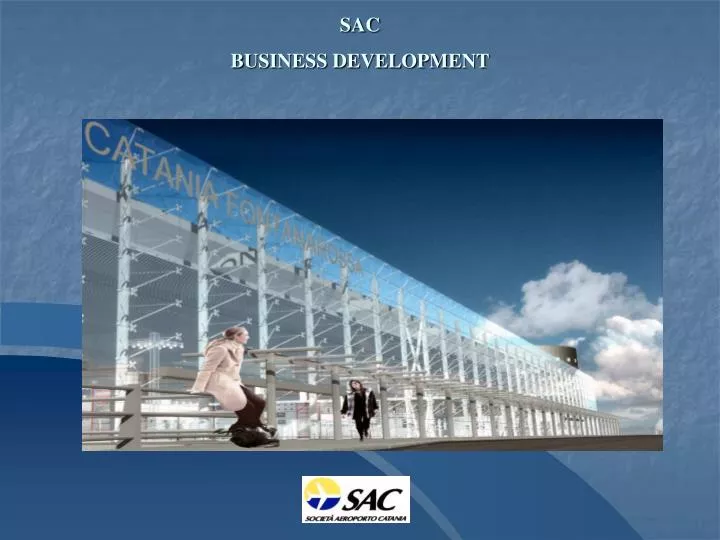
SAC BUSINESS DEVELOPMENT. a. 1%. 8%. 3%. Altro. RG. EN. AG. Messina. 7%. CT 49 %. SR. 12%. Fontanarossa. CL. 6%. Enna. ME. Catania. 14%. Caltanissetta. Agrigento. Siracusa. Ragusa. Passengers/inhabitants =>1. 0,7 < =Passengers/inhabitants <1.

E N D
SAC BUSINESS DEVELOPMENT a
1% 8% 3% Altro RG EN AG Messina 7% CT 49 % SR 12% Fontanarossa CL 6% Enna ME Catania 14% Caltanissetta Agrigento Siracusa Ragusa Passengers/inhabitants =>1 0,7 < =Passengers/inhabitants <1 Passengers/inhabitants <0,7 Catania Airport – Catchment Area Palermo Trapani • 7 provinces out of 9 (Agrigento is splitted between Palermo & Catania) • ~ 17.000 Kmq (65% of Sicilian Territory) • About 3 milions residents (62% of Sicily)
Passengers Traffic Volumes and Growth Indexes 2004 Passengers Data (mlns) Average Yearly Growth 1994 – 2004 (%) 5,8 5,1 4,6 6,8 % Italian Airports Int 0,9 3,7 3,3 3,1 1,7 0,5 2,9 2,3 Major Regional Airports 1,3 7,8 % 4,2 Dom 2,9 3,2 2,5 1,8 1,6 CTA 9,2 % BLQ TRN VCE CTA NAP PMO • Catania Fontanarossa is the 2nd Italian Regional Airport • Handlers ~ 5% of Italian Traffic with the best trend of traffic growth.
Passengers’ Profile Travel Motivation Travel Frequencies 100% 100% 7% Weekly 1 or more Tourism 31% 26% Monthly 1-2 Personal Reasons 18% Yearly 4 – 10 34% Yearly 1-3 50% Business 35% CTA CTA
13% 17% 24% 13% 4 % 63 % 71 % Carriers’ Traffic Distribution Passengers ('000) 5.108 4.807 4.077 3.925 3.970 17% Charter 22% 21% LCC 79 % 79% 78% FSC 2004 2000 2001 2002 2003 Source: Assaeroporti
Traffic Forecast 2004-2008 Mln Passengers 8,50 8,00 7,50 7.000.000 6.500.000 7,00 6.000.000 6,50 6,00 5.108.000 5,50 5,00 4,50 4,00 2004 2005 2007 2008 2006 IATA Low F(x) 40-year Plan I.J.K. IATA High
CATANIA AIRPORT – NEW TERMINAL INFRASTRUCTURAL DEVELOPMENT 2004 2006 delta % • Terminal: 13.000 mq 41.000 mq +215% • Parking: c.a. 2.000 c.a. 3.000 +50% • Stands: 16 25 +56% • Gates: 13 20 +54% • Chech-in desks: 41 58 +41%