Download
1 / 70
1.17k likes | 1.79k Views
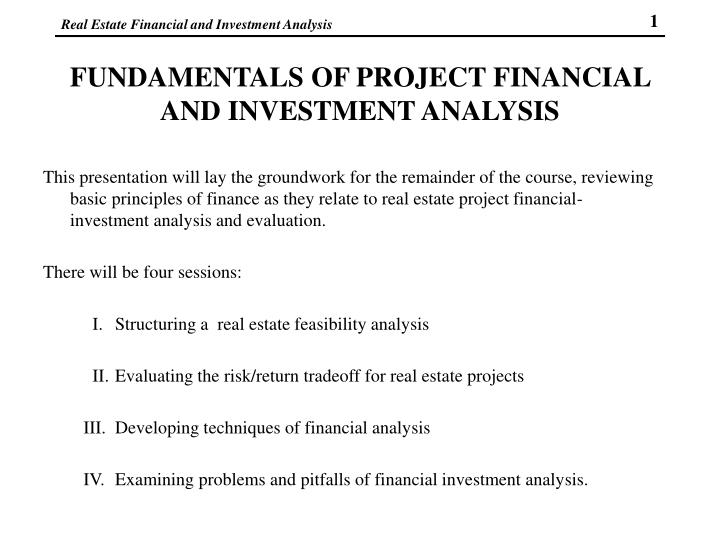
FUNDAMENTALS OF PROJECT FINANCIAL AND INVESTMENT ANALYSIS. This presentation will lay the groundwork for the remainder of the course, reviewing basic principles of finance as they relate to real estate project financial-investment analysis and evaluation. There will be four sessions:

E N D
FUNDAMENTALS OF PROJECT FINANCIAL AND INVESTMENT ANALYSIS This presentation will lay the groundwork for the remainder of the course, reviewing basic principles of finance as they relate to real estate project financial-investment analysis and evaluation. There will be four sessions: I. Structuring a real estate feasibility analysis II. Evaluating the risk/return tradeoff for real estate projects III. Developing techniques of financial analysis IV. Examining problems and pitfalls of financial investment analysis.
I. STRUCTURING A REAL ESTATEFEASIBILITY ANALYSIS This introductory session will address the concept of feasibility and real estate investment analysis; development of the first-year pro forma; and the usefulness of the CAP rate.
Yes, Virginia there are only three things that matter in real estate... • LOCATION! LOCATION! LOCATION! L REGIONAL FACTORS & MACROECONOMIC CIRCUMSTANCES x L x NEIGHBORHOOD ELEMENTS L SITE-SPECIFIC FEATURES
OUTLINE OF A FEASIBILITY STUDY • 1. Site Analysis • Survey of site to determine net useable land area • Zoning of site and related constraints • Availability of utilities to site • Subsurface soil conditions • Preliminary title report, CC & Rs • 2. Initial Concept • Establish target land development concept in terms of developer’s goals, permitted zoning, and developer’s financial resources
OUTLINE OF A FEASIBILITY STUDY • 3. Demand Analysis • Evaluate the economic base that supports the community in which project is located: • Population projections • Employment projections • Income Projections • Study the demand forces that pertain to your specific project type • Analyze the competitive market within which you must operate • 4. Supply Analysis • Determine market area related to project • Analyze the present and future inventory of product that you will be competing with in relation to your delivery date • Determine product mix in relation to competitive rents, pricing, and amenities
OUTLINE OF A FEASIBILITY STUDY • 5. Specific Development Scheme • With architects and engineers, developer relates concept to market conditions, with a specific development scheme, land use plan • 6. Cost Estimates • Based on a specific plan, developer then estimate all hard and soft costs based on the “bid date” of the project
OUTLINE OF A FEASIBILITY STUDY • 7. Financial Structure • Reviews profitability for go/no go decisions • Review mortgage loan ratios, terms of borrowing, equity position, tax considerations • Determine phasing, if any, and absorption rates • 8. Rate of Return Analysis • Review risk factors related to project • Review length of investment period • Determine rate of return “on” and “of” the investment
WILSHIRE BOULEVARD OFFICE BUILDING • Building Synopsis • Gross building area 205,000 sq. ft. • Net leasable area 176,000 sq. ft. (86%) • Parking structure 427 cars
Direct Costs Office building: 205,000 sq. ft. at $43/sq. ft. Parking structure Above grade: 22,420 sq. ft. at $24/sq. ft. Below grade: 125,000 sq. ft. at $28/sq. ft. Tenant improvements: 176,000 sq. ft. at $11/sq. ft. Site development Architectural & Engineering 6% of hard costs ($14,984,000) Contingency 5% of $15,883,040 TOTAL $8,815,000 538,000 3,511,000 1,936,000 84,000 889,040 794,152 $16,667,192 WILSHIRE BOULEVARD OFFICE BUILDING
Indirect Costs Real estate taxes 1% of direct cost plus land; 15 mos./2 Permits, legal fees, title, escrow, insurance Development fee: 3% of hard costs Leasing commission: 3% on $22 x 176,000 x 5 years Lease-up expense: $4/sq. ft. x 176,000 sq. ft. for 6 mos. Consulting fee TOTAL $123,000 150,000 500,015 580,800 352,000 150,000 $1,855,815 WILSHIRE BOULEVARD OFFICE BUILDING
TOTAL DIRECT AND INDIRECT COSTS Financing cost: 16% for 15 mos./2 on total costs & financing cost ($20,581,119) Land TOTAL COST INCLUDING FINANCING $18,523,007 2,058,112 3,000,000 $23,581,119 WILSHIRE BOULEVARD OFFICE BUILDING
WILSHIRE BOULEVARD OFFICE BUILDINGFULL-YEAR OPERATING PRO FORMA
BASIC ACCOUNTING FOR INCOME PROPERTIES • GROSS POSSIBLE INCOME (GPI) • - VACANCY AND BAD DEBT FACTOR • EFFECTIVE GROSS INCOME (EGI) • - OPERATING EXPENSES • NET OPERATING INCOME (NOI) OR NET EFFECTIVE INCOME • - DEBT SERVICE • CASH FLOW BEFORE TAXES (CFBT) • - NET TAXES* • NET SPENDABLE INCOME (NSI) • * CFBT + Principal Paydowns - Depreciation = TAXABLE INCOME
GRAPHIC INTERPRETATION OF CAP RATE MV=(1/k)NOI MV NOI
WHAT THE CAP RATE MUST TAKE INTO ACCOUNT • 1. Riskless Rate of Return • real return • inflationary adjustment • 2. Liquidity • 3. Management Return • 4. Parcel Specificity Risk
HOW TO CHOOSE THE CORRECT CAP RATE • How do you know what the correct capitalization rate is? Only by knowing intimately every feature of the property you are considering, along with the basic factors touched upon above: • Investor demand for and the existing supply of the particular type of property • Stability and security of future income • Capitalization rates of price earning ratios of alternate, non-real estate investments with comparable risk.
DETERMINING RISK AND DEMAND • The investor can determine risk and demand as it affects the CAP rate by carefully examining the property’s features: • 1. Exact Location • In the main business district, for example, even a few feet may make one location better than another. Access to mass transportation becomes increasingly important as the costs of private transportation and/or regulations become increasingly higher. • 2. Age of the Building • The older the building, the less future income can be derived from it in its present state. • 3. Size of the Land Parcel
DETERMINING RISK AND DEMAND • 4. Quality of the Tenancies • For example, other things being equal, a long-term lease represents more stable value than a short-term lease (e.g., hotel/motel room rentals are far less secure than apartment building leases). • 5. Existing Financing on the Property Even between properties of otherwise equal investment value, better financing on one may give it an apparently lower CAP rate. • 6. Operating Costs • Pay particular attention to higher energy costs for heating and air conditioning. In any comparison of buildings for investment purposes, the type of construction (glass walls, for example) can have an important bearing on those costs. Labor costs and the likelihood of continued increases also need to be considered.
EXCEL SPREAD SHEET AND CHART INSERTS • PP 16 - 22
II. EVALUATING THE RISK-RETURN TRADEOFF FOR A REAL ESTATE PROJECT • Now we will address the generation of the discounted cash flow, and take a first cut at financial ratio analysis.
DISCOUNTED CASH FLOW MODELS • I. DCF Model-Basic Data Requirements • A. Investment outlays • land costs • building costs • depreciation method • useful life • B. Operational characteristics • rental income • vacancy and collection factors • operating expenses • changes over time
DISCOUNTED CASH FLOW MODELS • I. DCF Model-Basic Data Requirements • C. Financing • amount of equity • amount of debt • amortization schedules • interest rates • required rate of return • D. Reversion • holding period • terminal value • debt retirement plans • reversion period expenses
DISCOUNTED CASH FLOW MODELS • I. DCF Model-Basic Data Requirements • E. Taxation elements • ordinary income • capital gains • recapture provisions • minimum tax, preference items
II. DCF MODEL: INPUTS AND OUTPUTS Basic Data Requirements of Model CASH FLOW ANALYSIS Annual Cash Flows during Holding Period Reversion Cash Flow at End of Holding Period Riskiness - Leverage - Coverage - Break-even Points Rate of Return - IRR/NPV Implicit Assumptions - CAP Rates - Price/Rent Ratios - Expense Ratios
RISK DICHOTOMY FOR REAL ESTATE Risk Assets Debt/Equity Business Risk Financial Risk
III. PROBLEMS INHERENT IN REAL ESTATE INVESTMENT ANALYSIS FOR INCOME PROPERTIES: UNDERLYING RISK ANALYSIS • A. Stabilized pro forma net operating income • B. Projected changes in operating expenses and revenue base • C. Projected selling price or refinancing value • D. Estimated holding period • E. Reinvestment opportunities • F. Tax effects and financing effects
A HIDDEN ISSUE IN MANY ANALYSIS:EXPECTED DISTRIBUTION OF RETURNS FOR INVESTMENTS
SPREAD SHEET ANALYSIS - 1986 TAX LAWS • EXCEL SPREAD SHEET AND CHART INSERTS
OFFICE BUILDING MARKET ANALYSIS • 1. KEY ELEMENT: Non manufacturing employment growth is the underlying demand generation for office space. • 2. Analysis of the office buildings, though related more or less to all sub-markets, must stratify the market into appropriate subsections (see Figure 1).
EXPLAINING OFFICE MARKET INSTABILITY • 1. High financial leverage typical of office building finance makes new construction highly sensitive to changes in mortgage money rates and terms. • 2. Tax shelter resulting from depreciation and interest deduction from taxable income provides a strong inducement to builders and investors to construct office buildings during periods of prosperity. • 3. Office building construction often reflects non-market considerations, such as corporate prestige and image.
EXPLAINING OFFICE MARKET INSTABILITY • 4. The elasticity of supplies of existing office space facilitates the postponement of new demand under conditions of uncertainty, high money rates, or recession. • 5. The eternal optimism of developers, the naivete of lenders, and the lack of sophisticated market analysis techniques prolong periods of over- and under-construction. • 6. The long planning and construction period required often results in continued high construction volume long after weakness becomes apparent in the demand for office space.
OFFICE SPACE MARKET ANALYSIS • Demand for office space results from • Expansion of space requirements by existing tenants • New tenants moving from other cities • New business firms in the community • Increases in supply of office space may result from • Existing tenants going out of business, reducing space, or moving to other cities • Addition of new office space being added (including remodeling) • Vacant office space available from previous years
OFFICE SPACE MARKET ANALYSIS • Example 1: Consider a community with following characteristics • 5 percent office-space vacancy target, Vn • Net real growth G of 1 million square feet of space • Upgrade demand U for 760,000 square feet • No space removed Or from inventory • 200,000 square feet of space added Ou to the market • 250,000 square feet of over hang Ov
OFFICE SPACE MARKET ANALYSIS • Example 2: Using the above data and not knowing the amount of space added Ou to the market, the absorption rate can be determined by first setting the market in equilibrium:
ANALYZING OFFICE BUILDING INVESTMENTS:SPECIFIC BUILDINGS • 1. Building-site specific • Street identity and prestige • Efficiency ratio for net rentable space • Percent of full floor users • Tenant improvements • Tenant mix • Tenant turnover and leasing conditions • Parking • 2. Locational features • Downtown • Airport • Regional shopping centers • Freeways/heavily traveled main roads
ANALYZING OFFICE BUILDING INVESTMENTS:SPECIFIC BUILDINGS • 3. Market elements • Amount and quality of competing space (correct strata) • Current rentals • Vacancies (and reasons for vacancies) • Absorption rates • Market capture potential • 4. Key to office building investment analysis • Purchase price of the property • Financing terms • Lease terms • Present and future levels of operating income and expenses • Future selling price • Applicable depreciation rules • Income and capital gains tax rates
III. DEVELOPNG THE TECHNIQUES OF FINANCIAL ANALYSIS • This session will focus on two of the most widely used analytic tools: • Net present value (NPV) • Internal rate of return (IRR)
FUNDAMENTALS OF INVESTMENT ANALYSIS MESURING RETURNS • I. Time Value of Money: Time and Risk • A certain dollar today is worth more than a certain dollar tomorrow • A risky dollar tomorrow is worth less than a more certain dollar tomorrow
I. TIME VALUE OF MONEY: TIME AND RISK • A. Timing: Present Value and Future Value • If $1.00 now could be invested at 10percent for one year, it would produce $1.10 as the total return. In this context, it is said that: • The present value (PV) of $1.10 next year is $1.00 • The future value (FV) of $1.00 today is $1.10 • The interest rate is the opportunity cost of funds
I. TIME VALUE OF MONEY: TIME AND RISK • B. NPV (net present value) and IRR (internal rate of return) • NPV = Discounted cash flow of benefit stream - Discounted cash flow of cost stream
Definition: IRR is a discount rate that takes the NPV = 0. Hence 10 percent is IRR of our example.