Download
1 / 40
400 likes | 460 Views
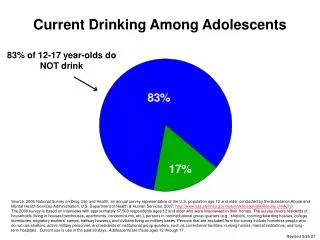
Current Drinking Among 12-17 Year-old African Americans. 88% of 12-17 year-old African Americans do NOT drink.

E N D
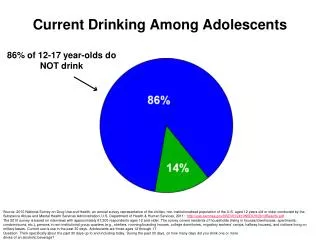
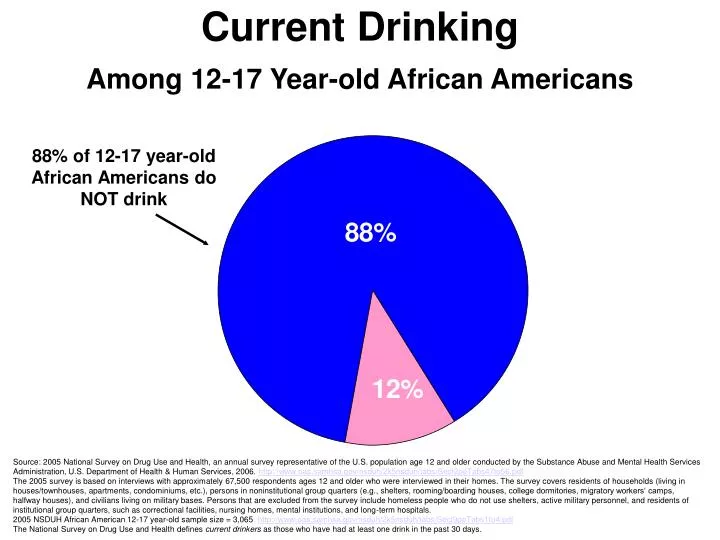
Current Drinking Among 12-17 Year-old African Americans 88% of 12-17 year-old African Americans do NOT drink Source: 2005 National Survey on Drug Use and Health, an annual survey representative of the U.S. population age 12 and older conducted by the Substance Abuse and Mental Health Services Administration, U.S. Department of Health & Human Services, 2006. http://www.oas.samhsa.gov/nsduh/2k5nsduh/tabs/Sect2peTabs47to56.pdf The 2005 survey is based on interviews with approximately 67,500 respondents ages 12 and older who were interviewed in their homes. The survey covers residents of households (living in houses/townhouses, apartments, condominiums, etc.), persons in noninstitutional group quarters (e.g., shelters, rooming/boarding houses, college dormitories, migratory workers‘ camps, halfway houses), and civilians living on military bases. Persons that are excluded from the survey include homeless people who do not use shelters, active military personnel, and residents of institutional group quarters, such as correctional facilities, nursing homes, mental institutions, and long-term hospitals. 2005 NSDUH African American 12-17 year-old sample size = 3,065 http://www.oas.samhsa.gov/nsduh/2k5nsduh/tabs/Sect9peTabs1to4.pdf The National Survey on Drug Use and Health defines current drinkers as those who have had at least one drink in the past 30 days.
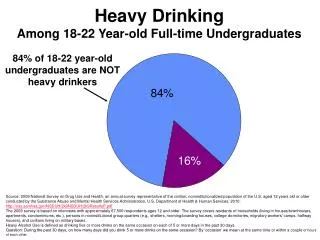
Heavy DrinkingAmong 12-17 Year-old African Americans 99% of 12-17 year-old African Americans are NOT heavy drinkers Source: 2005 National Survey on Drug Use and Health, an annual survey representative of the U.S. population age 12 and older conducted by the Substance Abuse and Mental Health Services Administration, U.S. Department of Health & Human Services, 2006. http://www.oas.samhsa.gov/nsduh/2k5nsduh/tabs/Sect2peTabs47to56.pdf The 2005 survey is based on interviews with approximately 67,500 respondents ages 12 and older who were interviewed in their homes. The survey covers residents of households (living in houses/townhouses, apartments, condominiums, etc.), persons in noninstitutional group quarters (e.g., shelters, rooming/boarding houses, college dormitories, migratory workers‘ camps, halfway houses), and civilians living on military bases. Persons that are excluded from the survey include homeless people who do not use shelters, active military personnel, and residents of institutional group quarters, such as correctional facilities, nursing homes, mental institutions, and long-term hospitals. 2005 NSDUH African American 12-17 year-old sample size = 3,065 http://www.oas.samhsa.gov/nsduh/2k5nsduh/tabs/Sect9peTabs1to4.pdf Heavy Alcohol Use is defined as drinking five or more drinks on the same occasion on each of 5 or more days in the past 30 days.
Drinking 5 or More Drinks on the Same OccasionAmong 12-17 Year-old African Americans 95% of 12-17 year-old African Americans do NOT drink 5+ drinks/occasion Source: 2005 National Survey on Drug Use and Health, an annual survey representative of the U.S. population age 12 and older conducted by the Substance Abuse and Mental Health Services Administration, U.S. Department of Health & Human Services, 2006. http://www.oas.samhsa.gov/nsduh/2k5nsduh/tabs/Sect2peTabs47to56.pdf The 2005 survey is based on interviews with approximately 67,500 respondents ages 12 and older who were interviewed in their homes. The survey covers residents of households (living in houses/townhouses, apartments, condominiums, etc.), persons in noninstitutional group quarters (e.g., shelters, rooming/boarding houses, college dormitories, migratory workers‘ camps, halfway houses), and civilians living on military bases. Persons that are excluded from the survey include homeless people who do not use shelters, active military personnel, and residents of institutional group quarters, such as correctional facilities, nursing homes, mental institutions, and long-term hospitals. 2005 NSDUH African American 12-17 year-old sample size = 3,065 http://www.oas.samhsa.gov/nsduh/2k5nsduh/tabs/Sect9peTabs1to4.pdf Drinking five or more drinks on the same occasion on at least 1 day in the past 30 days. By “occasion” is meant at the same time or within a couple hours of each other.
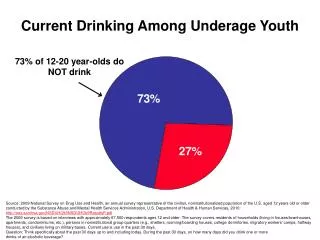
Current Drinking Among 12-20 Year-old African Americans 81% of 12-20 year-old African Americans do NOT drink Source: 2005 National Survey on Drug Use and Health, an annual survey representative of the U.S. population age 12 and older conducted by the Substance Abuse and Mental Health Services Administration, U.S. Department of Health & Human Services, 2006. http://www.oas.samhsa.gov/NSDUH/2k5NSDUH/AppG.htm#TabG-23 The 2005 survey is based on interviews with approximately 67,500 respondents ages 12 and older who were interviewed in their homes. The survey covers residents of households (living in houses/townhouses, apartments, condominiums, etc.), persons in noninstitutional group quarters (e.g., shelters, rooming/boarding houses, college dormitories, migratory workers‘ camps, halfway houses), and civilians living on military bases. Persons that are excluded from the survey include homeless people who do not use shelters, active military personnel, and residents of institutional group quarters, such as correctional facilities, nursing homes, mental institutions, and long-term hospitals. 2005 NSDUH African American 12-20 year-old sample size = 4,161 http://www.oas.samhsa.gov/nsduh/2k5nsduh/tabs/Sect9peTabs1to4.pdf The National Survey on Drug Use and Health defines current drinkers as those who have had at least one drink in the past 30 days.
Heavy DrinkingAmong 12-20 Year-old African Americans 98% of 12-20 year-old African Americans are NOT heavy drinkers Source: 2005 National Survey on Drug Use and Health, an annual survey representative of the U.S. population age 12 and older conducted by the Substance Abuse and Mental Health Services Administration, U.S. Department of Health & Human Services, 2006. http://www.oas.samhsa.gov/NSDUH/2k5NSDUH/AppG.htm#TabG-23 The 2005 survey is based on interviews with approximately 67,500 respondents ages 12 and older who were interviewed in their homes. The survey covers residents of households (living in houses/townhouses, apartments, condominiums, etc.), persons in noninstitutional group quarters (e.g., shelters, rooming/boarding houses, college dormitories, migratory workers‘ camps, halfway houses), and civilians living on military bases. Persons that are excluded from the survey include homeless people who do not use shelters, active military personnel, and residents of institutional group quarters, such as correctional facilities, nursing homes, mental institutions, and long-term hospitals. 2005 NSDUH African American 12-20 year-old sample size = 4,161 http://www.oas.samhsa.gov/nsduh/2k5nsduh/tabs/Sect9peTabs1to4.pdf Heavy Alcohol Use is defined as drinking five or more drinks on the same occasion on each of 5 or more days in the past 30 days.
Drinking 5 or More Drinks on the Same OccasionAmong 12-20 Year-old African Americans 91% of 12-20 year-old African Americans do NOT drink 5+ drinks/occasion Source: 2005 National Survey on Drug Use and Health, an annual survey representative of the U.S. population age 12 and older conducted by the Substance Abuse and Mental Health Services Administration, U.S. Department of Health & Human Services, 2006. http://www.oas.samhsa.gov/NSDUH/2k5NSDUH/AppG.htm#TabG-23 The 2005 survey is based on interviews with approximately 67,500 respondents ages 12 and older who were interviewed in their homes. The survey covers residents of households (living in houses/townhouses, apartments, condominiums, etc.), persons in noninstitutional group quarters (e.g., shelters, rooming/boarding houses, college dormitories, migratory workers‘ camps, halfway houses), and civilians living on military bases. Persons that are excluded from the survey include homeless people who do not use shelters, active military personnel, and residents of institutional group quarters, such as correctional facilities, nursing homes, mental institutions, and long-term hospitals. 2005 NSDUH African American 12-20 year-old sample size = 4,161 http://www.oas.samhsa.gov/nsduh/2k5nsduh/tabs/Sect9peTabs1to4.pdf Drinking five or more drinks on the same occasion on at least 1 day in the past 30 days. By “occasion” is meant at the same time or within a couple hours of each other.
Current (past month) Use of Alcohol Among Persons Aged 12-17 by Race/Ethnicity: 2005 National Survey on Drug Use and Health Source: 2005 National Survey on Drug Use and Health, an annual survey representative of the U.S. population age 12 and older conducted by the Substance Abuse and Mental Health Services Administration, U.S. Department of Health & Human Services, 2006, http://www.oas.samhsa.gov/nsduh/2k5nsduh/tabs/Sect2peTabs47to56.pdf
Five or More Drinks of Alcohol on the Same Occasion in the Past Month Among Persons Aged 12-17 by Race/Ethnicity: 2005 National Survey on Drug Use and Health Source: 2005 National Survey on Drug Use and Health, an annual survey representative of the U.S. population age 12 and older conducted by the Substance Abuse and Mental Health Services Administration, U.S. Department of Health & Human Services, 2006, http://www.oas.samhsa.gov/nsduh/2k5nsduh/tabs/Sect2peTabs47to56.pdf
Current (past month) Use of Alcohol Among Persons Aged 12-20 by Race/Ethnicity: 2005 National Survey on Drug Use and Health Source: 2005 National Survey on Drug Use and Health, an annual survey representative of the U.S. population age 12 and older conducted by the Substance Abuse and Mental Health Services Administration, U.S. Department of Health & Human Services, 2006, http://www.oas.samhsa.gov/NSDUH/2k5NSDUH/AppG.htm#TabG-23
Five or More Drinks of Alcohol on the Same Occasion in the Past Month Among Persons Aged 12-20 by Race/Ethnicity: 2005 National Survey on Drug Use and Health Source: 2005 National Survey on Drug Use and Health, an annual survey representative of the U.S. population age 12 and older conducted by the Substance Abuse and Mental Health Services Administration, U.S. Department of Health & Human Services, 2006, http://www.oas.samhsa.gov/NSDUH/2k5NSDUH/AppG.htm#TabG-23
Centers For Disease Control Youth Risk Behavior Survey High School Students Consumed At Least One Drink of Alcohol in the Past 30 Days Source: Youth Risk Behavior Survey (YRBS), Centers for Disease Control and Prevention. The YRBS is an in-school survey of students in grades 9 through 12. Students completed self-administered questionnaires in their classrooms. In 2005, the national sample consisted of 13,917 responses from 159 schools. In 1991, the national sample consisted of 12,272 responses from 137 schools. http://apps.nccd.cdc.gov/yrbss/QuestYearTable.asp?cat=3&Quest=Q41&Loc=XX&Year=2005&compval=&Graphval=no&path=byHT&loc2=&colval=2005&rowval1=Race&rowval2=Grade&ByVar=CI&Submit2=GO
Centers For Disease Control Youth Risk Behavior Survey High School Students Consumed Five or More Drinks of Alcohol in a Row in the Past 30 Days* Source: Youth Risk Behavior Survey (YRBS), Centers for Disease Control and Prevention. The YRBS is an in-school survey of students in grades 9 through 12. Students completed self-administered questionnaires in their classrooms. In 2005, the national sample consisted of 13,917 responses from 159 schools. In 1991, the national sample consisted of 12,272 responses from 137 schools. *“in a row, that is, within a couple of hours on one or more of the past 30 days.” http://apps.nccd.cdc.gov/yrbss/QuestYearTable.asp?cat=3&Quest=Q42&Loc=XX&Year=Trend&compval=&Graphval=no&path=byHT&loc2=&colval=All&rowval1=Race&rowval2=Grade&ByVar=CI&Submit2=GO
Centers For Disease Control Youth Risk Behavior Survey High School Students Students Who Had Their First Drink of Alcohol Other Than a Few Sips Before Age 13 Source: Youth Risk Behavior Survey (YRBS), Centers for Disease Control and Prevention. The YRBS is an in-school survey of students in grades 9 through 12. Students completed self-administered questionnaires in their classrooms. In 2005, the national sample consisted of 13,917 responses from 159 schools. In 1991, the national sample consisted of 12,272 responses from 137 schools. http://apps.nccd.cdc.gov/yrbss/QuestYearTable.asp?cat=3&Quest=Q40&Loc=XX&Year=Trend&compval=&Graphval=no&path=byHT&loc2=&colval=All&rowval1=Race&rowval2=Grade&ByVar=CI&Submit2=GO
Centers For Disease Control Youth Risk Behavior Survey High School Students Consumed At Least One Drink of Alcohol on One or More Days During Their Life Source: Youth Risk Behavior Survey (YRBS), Centers for Disease Control and Prevention. The YRBS is an in-school survey of students in grades 9 through 12. Students completed self-administered questionnaires in their classrooms. In 2005, the national sample consisted of 13,917 responses from 159 schools. In 1991, the national sample consisted of 12,272 responses from 137 schools. http://apps.nccd.cdc.gov/yrbss/QuestYearTable.asp?cat=3&Quest=Q39&Loc=XX&Year=Trend&compval=&Graphval=no&path=byHT&loc2=&colval=All&rowval1=Race&rowval2=Grade&ByVar=CI&Submit2=GO
Centers For Disease Control Youth Risk Behavior Survey High School Students Had At Least One Drink Of Alcohol On School Property Source: Youth Risk Behavior Survey (YRBS), Centers for Disease Control and Prevention. The YRBS is an in-school survey of students in grades 9 through 12. Students completed self-administered questionnaires in their classrooms. In 2005, the national sample consisted of 13,917 responses from 159 schools. In 1991, the national sample consisted of 12,272 responses from 137 schools. http://apps.nccd.cdc.gov/yrbss/QuestYearTable.asp?cat=3&Quest=Q43&Loc=XX&Year=Trend&compval=&Graphval=no&path=byHT&loc2=&colval=All&rowval1=Race&rowval2=Grade&ByVar=CI&Submit2=GO
Centers For Disease Control Youth Risk Behavior Survey High School Students Drove A Car When They Had Been Drinking (Past 30 Days) Source: Youth Risk Behavior Survey (YRBS), Centers for Disease Control and Prevention. The YRBS is an in-school survey of students in grades 9 through 12. Students completed self-administered questionnaires in their classrooms. In 2005, the national sample consisted of 13,917 responses from 159 schools. In 1991, the national sample consisted of 12,272 responses from 137 schools. http://apps.nccd.cdc.gov/YRBSS/QuestYearTable.asp?cat=1&Quest=Q11&Loc=XX&Year=Trend&compval=&Graphval=no&path=byHT&loc2=&colval=All&rowval1=Race&rowval2=Grade&ByVar=CI&Submit2=GO
Centers For Disease Control Youth Risk Behavior Survey High School Students Rode In A Car Driven By Someone Who Had Been Drinking (Past 30 Days) Source: Youth Risk Behavior Survey (YRBS), Centers for Disease Control and Prevention. The YRBS is an in-school survey of students in grades 9 through 12. Students completed self-administered questionnaires in their classrooms. In 2005, the national sample consisted of 13,917 responses from 159 schools. In 1991, the national sample consisted of 12,272 responses from 137 schools. http://apps.nccd.cdc.gov/YRBSS/QuestYearTable.asp?cat=1&Quest=Q10&Loc=XX&Year=Trend&compval=&Graphval=no&path=byHT&loc2=&colval=All&rowval1=Race&rowval2=Grade&ByVar=CI&Submit2=GO
Thirty-Day Prevalence for 8th Graders – Alcohol By Race SOURCE: The Monitoring the Future Study, the University of Michigan. http://www.monitoringthefuture.org/pubs/monographs/vol1_2005.pdf , Table D-63. To derive percentages for each racial subgroup, data for the specified year and the previous year have been combined to increase subgroup sample sizes and thus provide more stable estimates.
Thirty-Day Prevalence for 8th Graders – Beer By Race SOURCE: The Monitoring the Future Study, the University of Michigan. http://www.monitoringthefuture.org/pubs/monographs/vol1_2005.pdf , Table D-72. To derive percentages for each racial subgroup, data for the specified year and the previous year have been combined to increase subgroup sample sizes and thus provide more stable estimates.
Thirty-Day Prevalence for 8th Graders – Wine Coolers By Race SOURCE: The Monitoring the Future Study, the University of Michigan. http://www.monitoringthefuture.org/pubs/monographs/vol1_2004.pdf, Table D-82, Page 626. Twelfth-grade data are reported for beer, spirits, wine, wine coolers, and, beginning in 2003, flavored alcoholic beverages. For the two lower grades, the questionnaires were restricted to beer and wine coolers (though the category of wine coolers was dropped from the questionnaires in 2004 to make space for a more general class of flavored alcoholic beverages). To derive percentages for each racial subgroup, data for the specified year and the previous year have been combined to increase subgroup sample sizes and thus provide more stable estimates.
Two-Week Prevalence for 8th Graders 5+ Drinks in a Row – Beer By Race SOURCE: The Monitoring the Future Study, the University of Michigan. http://www.monitoringthefuture.org/pubs/monographs/vol1_2005.pdf , Table D-75. To derive percentages for each racial subgroup, data for the specified year and the previous year have been combined to increase subgroup sample sizes and thus provide more stable estimates.
Thirty-Day Prevalence for 8th Graders – Been Drunk By Race SOURCE: The Monitoring the Future Study, the University of Michigan, http://www.monitoringthefuture.org/pubs/monographs/vol1_2005.pdf Table D-66, Page 607. To derive percentages for each racial subgroup, data for the specified year and the previous year have been combined to increase subgroup sample sizes and thus provide more stable estimates.
Two-Week Prevalence for 8th Graders 5+ Drinks in a Row – Alcohol By Race SOURCE: The Monitoring the Future Study, the University of Michigan, http://www.monitoringthefuture.org/pubs/monographs/vol1_2005.pdf Table D-69, Page 610. To derive percentages for each racial subgroup, data for the specified year and the previous year have been combined to increase subgroup sample sizes and thus provide more stable estimates.
Thirty-Day Prevalence for 10th Graders – Alcohol By Race SOURCE: The Monitoring the Future Study, the University of Michigan, http://www.monitoringthefuture.org/pubs/monographs/vol1_2005.pdf Table D-64, Page 604. To derive percentages for each racial subgroup, data for the specified year and the previous year have been combined to increase subgroup sample sizes and thus provide more stable estimates.
Thirty-Day Prevalence for 10th Graders – Beer By Race SOURCE: The Monitoring the Future Study, the University of Michigan, http://www.monitoringthefuture.org/pubs/monographs/vol1_2005.pdf Table D-73, Page 615. To derive percentages for each racial subgroup, data for the specified year and the previous year have been combined to increase subgroup sample sizes and thus provide more stable estimates.
Thirty-Day Prevalence for 10th Graders – Wine Coolers By Race SOURCE: The Monitoring the Future Study, the University of Michigan. http://www.monitoringthefuture.org/pubs/monographs/vol1_2004.pdf, Table D-83, Page 627. Twelfth-grade data are reported for beer, spirits, wine, wine coolers, and, beginning in 2003, flavored alcoholic beverages. For the two lower grades, the questionnaires were restricted to beer and wine coolers (though the category of wine coolers was dropped from the questionnaires in 2004 to make space for a more general class of flavored alcoholic beverages). To derive percentages for each racial subgroup, data for the specified year and the previous year have been combined to increase subgroup sample sizes and thus provide more stable estimates.
Thirty-Day Prevalence for 10th Graders – Been Drunk By Race SOURCE: The Monitoring the Future Study, the University of Michigan, http://www.monitoringthefuture.org/pubs/monographs/vol1_2005.pdf Table D-67, Page 608. To derive percentages for each racial subgroup, data for the specified year and the previous year have been combined to increase subgroup sample sizes and thus provide more stable estimates.
Two-Week Prevalence for 10th Graders 5+ Drinks in a Row – Alcohol By Race SOURCE: The Monitoring the Future Study, the University of Michigan, http://www.monitoringthefuture.org/pubs/monographs/vol1_2005.pdf Table D-70, Page 611. To derive percentages for each racial subgroup, data for the specified year and the previous year have been combined to increase subgroup sample sizes and thus provide more stable estimates.
Two-Week Prevalence for 10th Graders 5+ Drinks in a Row – Beer By Race SOURCE: The Monitoring the Future Study, the University of Michigan, http://www.monitoringthefuture.org/pubs/monographs/vol1_2005.pdf Table D-76, Page 619. To derive percentages for each racial subgroup, data for the specified year and the previous year have been combined to increase subgroup sample sizes and thus provide more stable estimates.
Thirty-Day Prevalence for 12th Graders – Been Drunk By Race SOURCE: The Monitoring the Future Study, the University of Michigan, http://www.monitoringthefuture.org/pubs/monographs/vol1_2005.pdf Table D-68, Page 609. To derive percentages for each racial subgroup, data for the specified year and the previous year have been combined to increase subgroup sample sizes and thus provide more stable estimates.
Thirty-Day Prevalence for 12th Graders – Alcohol By Race SOURCE: The Monitoring the Future Study, the University of Michigan, http://www.monitoringthefuture.org/pubs/monographs/vol1_2005.pdf Table D-65, Page 605-606. To derive percentages for each racial subgroup, data for the specified year and the previous year have been combined to increase subgroup sample sizes and thus provide more stable estimates.
Thirty-Day Prevalence for 12th Graders – Liquor By Race SOURCE: The Monitoring the Future Study, the University of Michigan, http://www.monitoringthefuture.org/pubs/monographs/vol1_2005.pdf Table D-78, Page 622-623. To derive percentages for each racial subgroup, data for the specified year and the previous year have been combined to increase subgroup sample sizes and thus provide more stable estimates.
Thirty-Day Prevalence for 12th Graders – Beer By Race SOURCE: The Monitoring the Future Study, the University of Michigan, http://www.monitoringthefuture.org/pubs/monographs/vol1_2005.pdf Table D-74, Page 616-617. To derive percentages for each racial subgroup, data for the specified year and the previous year have been combined to increase subgroup sample sizes and thus provide more stable estimates.
Thirty-Day Prevalence for 12th Graders – Wine Coolers By Race SOURCE: The Monitoring the Future Study, the University of Michigan, http://www.monitoringthefuture.org/pubs/monographs/vol1_2005.pdf Table D-84, Page 632 To derive percentages for each racial subgroup, data for the specified year and the previous year have been combined to increase subgroup sample sizes and thus provide more stable estimates.
Thirty-Day Prevalence for 12th Graders – Wine By Race Note: In the 1988 questionnaires, a question on the use of wine coolers was added. This change may account for the discontinuity between the 1987 and 1988 use rates for wine. SOURCE: The Monitoring the Future Study, the University of Michigan, http://www.monitoringthefuture.org/pubs/monographs/vol1_2005.pdf Table D-80, Page 626-627 To derive percentages for each racial subgroup, data for the specified year and the previous year have been combined to increase subgroup sample sizes and thus provide more stable estimates.
Two-Week Prevalence for 12th Graders 5+ Drinks in a Row – Beer By Race SOURCE: The Monitoring the Future Study, the University of Michigan. http://www.monitoringthefuture.org/pubs/monographs/vol1_2005.pdf Table D-77, Page 620-621 To derive percentages for each racial subgroup, data for the specified year and the previous year have been combined to increase subgroup sample sizes and thus provide more stable estimates.
Two-Week Prevalence for 12th Graders 5+ Drinks in a Row – Alcohol By Race SOURCE: The Monitoring the Future Study, the University of Michigan, http://www.monitoringthefuture.org/pubs/monographs/vol1_2005.pdf Table D-71, Page 612-613 To derive percentages for each racial subgroup, data for the specified year and the previous year have been combined to increase subgroup sample sizes and thus provide more stable estimates.
Two-Week Prevalence for 12th Graders 5+ Drinks in a Row – Liquor By Race SOURCE: The Monitoring the Future Study, the University of Michigan, http://www.monitoringthefuture.org/pubs/monographs/vol1_2005.pdf Table D-79, Page 624-625 To derive percentages for each racial subgroup, data for the specified year and the previous year have been combined to increase subgroup sample sizes and thus provide more stable estimates.
Two-Week Prevalence for 12th Graders 5+ Drinks in a Row – Wine By Race SOURCE: The Monitoring the Future Study, the University of Michigan, http://www.monitoringthefuture.org/pubs/monographs/vol1_2005.pdf Table D-81, Page 628-629 To derive percentages for each racial subgroup, data for the specified year and the previous year have been combined to increase subgroup sample sizes and thus provide more stable estimates.
Two-Week Prevalence for 12th Graders 5+ Drinks in a Row – Wine Coolers By Race SOURCE: The Monitoring the Future Study, the University of Michigan, http://www.monitoringthefuture.org/pubs/monographs/vol1_2005.pdf Table D-85, Page 633 To derive percentages for each racial subgroup, data for the specified year and the previous year have been combined to increase subgroup sample sizes and thus provide more stable estimates.