Download

1 / 77
800 likes | 893 Views
Broadband Communication Systems. Teaching Scheme Examination Scheme Lectures / Week: 4Hrs Paper: In sem (30M)+ End Sem (70 M) Practical Exam : 50 Marks Term work: 50 Marks (MC and BCS) ( L ab Practice III). Unit I. Light Wave System Components. Objectives.

E N D
Broadband Communication Systems • Teaching Scheme Examination Scheme • Lectures / Week: 4Hrs Paper: In sem (30M)+ End Sem (70 M) • Practical Exam : 50 Marks • Term work: 50 Marks (MC and BCS) (Lab Practice III)
Unit I Light Wave System Components
Objectives To understand the three primary components of a fiber-optic communication system
Advantages of OFC • Enormous potential bandwidth • Small size and weight • Electrical isolation • Immunity to Interference and crosstalk • Signal Security • Low transmission loss • Rugedness and flexibility • System reliability and ease of maintenance • Potential low cost
Disadvantages of OFC • Attenuation and Dispersion • Cost (Initial cost of installation)is higher than Copper cables • Technical skilled personnel is needed. • Special equipment is needed
Applications of OFC • In Flexible Digital Cameras • Medical Imaging such as endoscopes and laparoscopes • Under sea communication • Aircrafts, ships, tanks • Railways, TV transmissions, • LAN systems in offices, industries and colleges • Voice telephones, video phones, telegraphs and message services and data networks
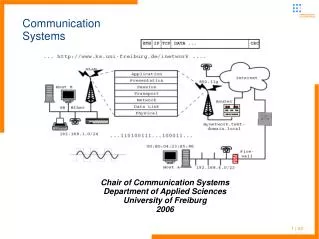
Operating range of OFC & characteristics of the four key link components
Optical fiber attenuation as a function of wavelength (Three Windows)
a) Refraction b) limiting case of refraction c) total internal reflection
Meridional ray propagation in an ideal step index optical wave guide
a) Skew rays in optical fiberb) Cross sectional view of fiber
Refractive index profile & ray transmission in step index fibersa)multimode step index(MSI) b) single mode step index fibre
Possible fiber refractive index profiles for different values of α
Refractive index profile & ray transmission in a multimode graded index fiber
Comparison of single mode & multimode step index &graded index optical fibers
MFD and spot size • MFD- Measure far field intensity distribution (r) . For Gaussian Distribution MFD = with of the optical power • MFD is important parameter for Single mode fiber and used to predict splice loss, bending loss, cut off wavelength and waveguide dispersion • MFD = 2 is called spot size which is full width of the far field distribution.
Distribution of light in a single mode fiber above its cutoff wavelength. For Gaussian distribution MFD is 1/e2 width of the optical fiber
Signal degradation in optical fiber (Losses in Optical Fiber) I.Absorption- Caused by three mechanisms • Absorption by atomic defects(imperfections in atomic structure of the fiber material) in the glass composition • Extrinsic absorption by impurity atoms in the glass material • Intrinsic absorption by the basic constituent atoms of the fiber material. It occurs when material is in perfect state with no density variation, impurities, material inhomegenities.
Signal degradation in optical fiber (Losses in Optical Fiber) II. Scattering losses (Linear and Nonlinear) Linear Scattering losses-causes the transfer of some or all of the optical power contained within one propagating mode to be transferred linearly into different mode. This causes attenuation of transmitted light to a leaky or radiation mode and not propagate within fiber core. Types of Linear Scattering i) Rayleigh scattering and ii) Mie Scattering
Signal degradation in optical fiber (Losses in Optical Fiber) • i) Rayleigh scattering- It results from inhomogeneities (refractive index fluctuations) of a random nature occurring on a small scale compared with wavelength of light. This produces attenuation proportional to • Can be reduced by improved fabrication
Signal degradation in optical fiber (Losses in Optical Fiber) ii) Mie Scattering- The scattering created by homegeneities like irregularities in core-cladding interface, core cladding refractive index difference along fiber length, diameter fluctuations, strains and bubbles are mainly in forward direction and are called Mie scattering. They can be reduced by- a)removing imperfections due to glass manufacturing process b) Carefully controlled extrusion and coating of fiber c) increasing fiber guidance by increasing Δ
Signal degradation in optical fiber (Losses in Optical Fiber) Non linear scattering losses- causes the optical power from one mode to be transferred in either forward or backward direction to the same, or other modes at different frequency. Types of Non linear scattering losses- i) Stimulated Brillouin Scattering (SBS) and ii) Stimulated Raman Scattering (SRS) i) Stimulated Brillouin Scattering (SBS)- Significant above threshold power density .Modulation of light through thermal molecular vibration within the fiber. Threshold power = 4.4 x Watts where terms with usual meaning , is source bandwidth in GHz. SBS is mainly backward process.
Signal degradation in optical fiber (Losses in Optical Fiber) ii) Stimulated Raman Scattering (SRS) –Occur in both forward an backward direction in an optical fiber . Threshold power of SRS is 3 order of magnitude higher than Threshold power of SBS. Threshold power = 5.9 x Watts
Fiber Perturbation which gives mode couplinga) irregularity at the core-cladding interfaceb) fiber bend
Exponentially decaying evanescent field in the cladding of optical wave guide
Signal degradation in optical fiber (Losses in Optical Fiber) Bending Losses- Optical fiber suffers radiation losses at the bend or curves. Energy in the evanescent field at the bend exceeds the velocity of light in cladding and hence guidance mechanism is disturbed and light energy gets radiated from the fiber.
Bending losses • Small scale fluctuations in the radius of curvature of the fiber axis leads to microbending losses. Microbends can shed higher order modes and can cause power from low order modes to couple to higher order modes. • The total no of modes supported by a curved fiber is less than in comparison with straight fiber.
Bending losses Macrobending losses may be reduced by • Designing fiber with large Δ • Operating at shortest wavelength Microbending losses can be minimized by extruding a compressible jacket over the fiber
Dispersion • Intermodal Dispersion-Dispersion caused by multipath propagation of light energy. • Signal degradation occurs due to different values of group delay for each individual mode at a single frequency. • Intramodal or Chromatic Dispersion: pulse broadening within single mode is called Intramodal Dispersion or chromatic dispersion. It is also called GVD. Two main causes of Intramodal or Chromatic Dispersion • Material Dispersion • Waveguide Disperion
Dispersion • Material Dispersion- i) pulse spreading due to dispersive properties of material ii)It occurs from variation of refractive index of core as a function of wavelength • Waveguide Dispersion- i) It occurs because a single mode fiber confines only about 80 % of optical power to the core ii) Dispersion thus arises since 20 % light propagating in the cladding travels faster than light confined to core iii) this dispersion depends upon structure of fiber and can be varied by changing NA, core radius. • Thus = + + ps/nm/km
Requirements of Optical Sources (LEDs) LED requirements: • Simple fabrication-No mirror facets, no striped geometry • Cost- Reduced cost due to simple constructions • Reliability-Do not exhibit catastrophic degradation , less sensitive to gradual degradation than Lasers • Generally Less Temperature dependence-The light output against current characteristics less affected by temperature than corresponding characteristics for injection Laser. • Simple drive circuitry-Low drive currents and reduced temp dependence and hence temp compensation is unnecessary • Linearity- dependence-The light output against current characteristics of LED are linear unlike injection laser.
HomojunctionVsHetrojunction LEDs • Homojunction LEDs-Interface that occurs between layers of similar semiconductor material. They have equal bandgaps but different dopings e.g. interface between n-type and p-type • HetrojunctionLEDs-Interface that occurs between two layers or regions of dissimilar crystalline semiconductor.They have unequal bandgaps. Used in Lasers, solar cells
Double hetero junction LEDa) layer structure shown with an applied forward biasb) the corresponding energy diagram