Download

1 / 22
220 likes | 225 Views
This study analyzes the positive effects of operating systems (OS) and network externalities on the interface among modules or users. It explores the impact of word processors, spreadsheet, routers, API, and file formats. The study also discusses the monopoly tendencies and the importance of open interfaces.

E N D
Positive analysis of OS and the network externalities Faculty of Economics, Keio University Tatsuo TANAKA Email:tanaka@tatsuo.econ.keio.ac.jp
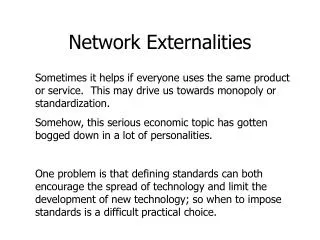
Application software Users Users Router Router API Operating system File Format Word processor and spreadsheet Routers Network externality works in terms of the interface among modules or users. • Word Processor and spreadsheet • Modules are users • Interface is file format (+ friends-are-teacher effects) • Routers • Modules are users (or routers) • Interface is TCP/IP protocol and its implementation • PC’s OS • Modules are application software and OS. • Interface is API. OS
When interface is not open, there exists a tendency towards monopoly even if firms obey the fair trade rules. Once the monopoly is established, no firm can challenge the monopoly firm unless there is a “huge” innovation that overcomes the benefit of the network externality. (so-called “lock-in”) Competition becomes weak. The price remains high and incentive for innovation becomes low. (Losses of monopoly) The monopoly firm will try to extend the monopoly by bundling complimentary products to its monopoly module (“leverage”) Market structure : two contrary views View I View II • Such “huge” innovations are common in the information technology related industries. • History shows successive changes of the dominant firms in the IT industries. Windows faces potential challengers such as Linux. • Decrease of price, enough incentive for innovations. • Bundling the compliments into the products is beneficial to the users
[First best] Make the interface open so that other firms can reap benefits from the network externality. In other word, the interface (e.g., API) should be unbundled from the specific products. [Second best] Disintegrate the product or company into the monopoly module and other modules. In other words, the monopoly module (e.g., OS) should be unbundled from other modules (e.g., applications). Solutions : two contrary views View I View II • The first solution discourages the incentive for innovations. • The second solution is harmful to users because bundling the products is beneficial to the users.
Step3: Consider solutions’ cost and benefits Make interface open Disintegrate the product Is network externality strong? No Ordinary competition policy Yes Losses from monopoly? No Watch anti-competitive action Yes Not effective Solutions’ effects and side effects Watch anti-competitive action effective Our approach to this issue • Start: High and stable share or profit. Strategic(predatory) pricing. • Step 1: Estimate network externality • Compare the effect of network externality with functional changes by innovations. • Step 2: Evaluate losses from monopoly • Price: Does price decrease continuously? • Innovations: Does the speed of innovation get slower? Solutions 1) make the interface open 2)disintegrate the product
Today’s subject: OS • User survey (n=3319) • History of OS usage during 1993-2004 • Reason of choice of OS • Subjective evaluation of the OS • Number of application software he/she regularly uses. • Price of OS • Presumption of this study • Users remember his usage history of OS well. 93 94 95 96 97 98 99 00 01 02 03 04 OS MacOS W98 W2000 WXP Reason 1 2 3 3 NofAppli 5 7 8 7 Price NA 25k NA NA
Functions(Innovation) Network Externalities Switching Cost NE + SC Price Others Question:Why did you choose the OS? • Reason of Choice • 1)Excellent functions • 2)Many application on this OS • 3)Many users to ask for advise • 4)Already bought applications on this OS • 5)I get used to the operation of this OS • 6)Same OS as in my company • 7)Low price • 8)No other choice in the PC shop • 9)I just choose PC hard • 10)Other
Price new old Reason of OS choice:Windows Functions :Increased 10%25% Network E. :Decrease 40%20% Switching C. :Increased 5%15%
new old Reason of OS choice:Mac OS Functions :30%~45% Network E. :Decrease 20%10% Switching C. :Increased 5%20%
Variables: how to measure • Functions • Users’ subjective evaluation of the OS • Q:”Please evaluate the OS by score 0 ~ 100” • Network Externalities • Share of the OS • Dummy for the largest share OS • Switching Cost • Number of application software in use. • Price • Average of users’ reports Vij:utility when OS i’s user chooses OS j as a new OS. Vij=a + b*Pricej + c*Functionj + d*Switching Costij + e*Network Effectj
Windows MacOS Average score of of all users Functions:Subjective Evaluation of OS’s functionsQ:” Evaluate the functions of the OS by score 0 – 100.” Functional evaluation has increased. Innovations continue. Windows’ score is slightly higher than MacOS Functional difference can explain Windows’ larger share to some extent.
MacOs Number of Users by OS versions (total=3319)
NetworkExternalities:Share of Windows and MacOS Windows share has increased steadily from 70-80% to 90% Windows Network Externalities has increased. The difference of the share is over 80% MacOS
Windows MacOS Average number of software of the OS users Switching Cost: Number of software Q:” How many application software do you use regularly? “ Number of software has increased to around 7. Switching cost has increased No difference between Windows’ users and MacOS users. Variance among users are very large.
Windows MacOS Price of OSQ:” Write your OS’s price if you purchased it” Price of Windows increased, whereas price of MacOS decreased. Since MacOS9, Windows are more expensive than MacOSs
Model: OS i,j = Windows or MacOS Vkij:utility when user k using OS i chooses OS j as a new OS. Vkij=a + b*Functionkj + c*Network Externalitiesj + d*Switching Costkij + e*Pricej • Functionkj:user k’s subjective evaluation of the OS j • Network Externalitiesj • (1) Market share of OS j • (2) Dummy for the Windows • Switching Costkij : • If i=j, 0 • if i is not equal to j, number of software in use of user k • Pricej: average price of OS j Users choose OS j that Vkij> Vkij’ for other OS j’ Discrete choice model
Estimated result and interpretation Significant, and sign is as expected except for price Assume 80% difference in share. How much functional advance is necessary to beat Network E? (0.0244*80)=1.949 utility 1.949/0.0522=37.3 Assume 7 application software. How much functional advance is necessary to beat switching cost? (0.1589*7)=1.11 utility 1.11/0.0522=21.3 Need 37 points gain in function to beat network externalities. Need 21 points gain in function to beat switching cost.
Does innovation beat the network externalities and switching cost? • Need 37 points to beat NE, 21 points to beat SC. Total=58 points • Increase of functional improvement of version-up has been about 10points(See the graph again) 58 point is correspond to5.8 times version-ups. In other words, if we assume that version-up is done in 2.5 years, new OS maker needs to make OS with over 15-years advanced technologies. It is almost impossible. Thus, there is entry barrier that is not likely to be overcome by innovations.
Critiques: These policies harm the incentive for the innovation of new interface How to introduce competition • (1) Compatibility: Opening the interface completely. • API of OS • File format of MS Word and Excel • Former Interface, Current Interface, Next Interface • (2) Disintegration or Regulation of vertical integration • Separating the noncompetitive part (OS or Office) from the competitive part(other application software)
Discourage the innovation welfare loss Competition is recovered welfare gain Benefit of users and future innovators Benefit of current innovators weak Patent strong protection Optimum level of incentive Opening the interface Which is large? A special case of general question of incentive design for innovation Patent scope: narrow --- wide Patent period: short --- long Interface: How many years of monopoly is optimal? #monopoly=single firm’s control.
User’s benefit + Future innovator’s benefit Current innovator’s benefit Social optimum Case of Interface Question: Let’s assume that we make Microsoft to open the interface. Does it discourage critically potential innovators who want to be next Bill Gates? Does it encourage innovators who want to challenge Microsoft by providing compatible goods? If so, users also get the benefit. Opening : Next Current Former not open Version version version Monopoly: 5years 10years 15years unlimited period