Download
1 / 38
380 likes | 392 Views
This project at The Ohio State University aims to measure and compile surface velocity fields for polar ice sheets and analyze velocity gradients. The results will be used to investigate properties of the glacial bed and develop maps using satellite imagery. The project also involves outreach activities and web-based seminars.

E N D
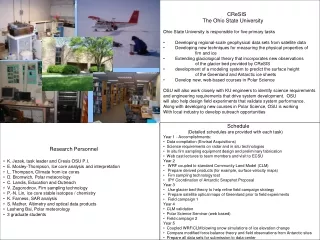
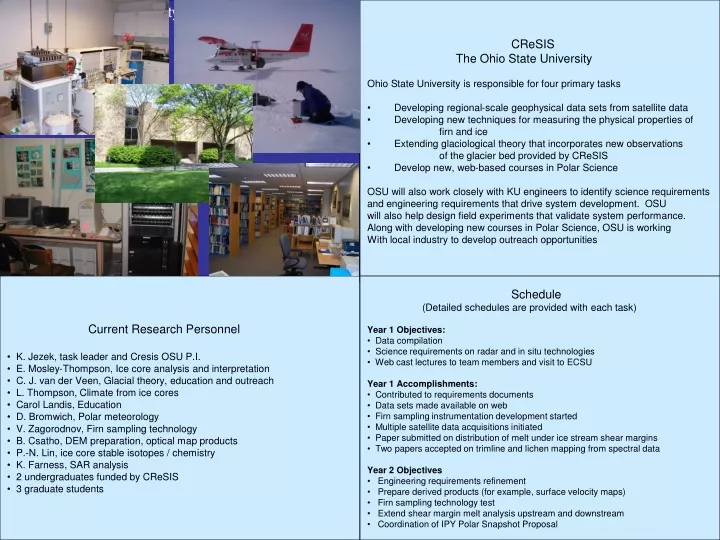
Analysis of Surface Velocity Fields • CReSIS • The Ohio State University • Ohio State University is responsible for four primary tasks • Developing regional-scale geophysical data sets from satellite data • Developing new techniques for measuring the physical properties of • firn and ice • Extending glaciological theory that incorporates new observations • of the glacier bed provided by CReSIS • Develop new, web-based courses in Polar Science • OSU will also work closely with KU engineers to identify science requirements • and engineering requirements that drive system development. OSU • will also help design field experiments that validate system performance. • Along with developing new courses in Polar Science, OSU is working • With local industry to develop outreach opportunities • Current Research Personnel • K. Jezek, task leader and Cresis OSU P.I. • E. Mosley-Thompson, Ice core analysis and interpretation • C. J. van der Veen, Glacial theory, education and outreach • L. Thompson, Climate from ice cores • Carol Landis, Education • D. Bromwich, Polar meteorology • V. Zagorodnov, Firn sampling technology • B. Csatho, DEM preparation, optical map products • P.-N. Lin, ice core stable isotopes / chemistry • K. Farness, SAR analysis • 2 undergraduates funded by CReSIS • 3 graduate students • Schedule • (Detailed schedules are provided with each task) • Year 1 Objectives: • Data compilation • Science requirements on radar and in situ technologies • Web cast lectures to team members and visit to ECSU • Year 1 Accomplishments: • Contributed to requirements documents • Data sets made available on web • Firn sampling instrumentation development started • Multiple satellite data acquisitions initiated • Paper submitted on distribution of melt under ice stream shear margins • Two papers accepted on trimline and lichen mapping from spectral data • Year 2 Objectives • Engineering requirements refinement • Prepare derived products (for example, surface velocity maps) • Firn sampling technology test • Extend shear margin melt analysis upstream and downstream • Coordination of IPY Polar Snapshot Proposal
Analysis of Surface Velocity Fields Analysis of Surface Velocity Field and Velocity Gradients The Ohio State University This task will measure and compile the surface velocity fields for the polar ice sheets. Velocity fields are already available for portions of the Antarctic from the MAMM project. Additional Radarsat InSAR data were for interior Antarctica during AMM-1 and new data about the perimeter have been collected through 2005. Velocity gradients and derived field will be analyzed using a proposed variant of the conventional force budget technique. The results will be used in comparison with CReSIS imaging radar data to investigate properties of the glacial bed. In addition, the task will develop maps of Cresis study sites using optical satellite imagery and satellite altimeter systems. As part of this task, the PI will visit ECSU to give presentations on Polar Science and to interact with students and staff. Two web-based Polar Science Seminars will also be offered. • Current Research Personnel • K. Jezek, task leader and Cresis OSU P.I. • B. Csatho, DEM preparation and site maps creation • K. Farness, InSAR processing • 2, CReSIS fundeded undergraduate students involved with • feature retracking velocities and data rescue (K. Leibfacher, S. Westfall) • 1 grad student (J. Wuite) • Schedule • Year 1 Objectives: • Assemble available SAR Data and available derived velocities • Assemble available DEM Data (Ekholm, Bamber, IceSAT) • Develop complete 3-d force theory • Invited talk at ECSU • Year 1 Accomplishments • Two undergraduates involved in research • SAR data products available on web site • Envisat data acquisitions submitted and data being received • TerraSAR X data acquisition request approved • Radarsat Greenland data scheduled to be delivered in June • Envisat upgrade to procesing software installed • Several DEMs received, compared and integrated • Net forces computed on several glaciers • Paper submitted on melt beneath shear margins • Year 2 Objectives • Complete integrated 200 m DEM of Greenland • Create SAR mosaics and begin InSAR processing (Envisat) • Apply 3-d force theory to Antarctic MAMM data • IPY Coordination of Antarctic Snapshot Proposal
High Resolution Analysis of the Physical and Chemical Properties of Snow and Firn using Multiple Technologies The Ohio State University Ice Core Paleoclimate Group Conductivity Electrodes Volcanic events, annual layers Bandsaw cut Mill cut emitter Rotor bit Laser diodes receiver Melter High resolution, in situ measurements of the physical and chemical properties of firn and ice, along with annual snow accumulation are essential for correct interpretation of airborne and satellite-borne remote sensing data. Density is one of the most difficult properties to measure and is best evaluated in situ. At least three different tools will be constructed, tested, and deployed to measure density with high vertical resolution and increased precision over current methods. Near-surface densities that change rapidly with depth will be given special attention. Ideally the speedograph will be calibrated so that many shallow (< 20 meter) profiles can be measured quickly in a region. This is critical as density can be highly variable over small distances, especially in regions where the snow facies are not dry and the degree of melt and refreezing is laterally variable. Speedograph penetration is a function of density Schedule • Year 1 Objectives and Accomplishments [Design, Fabrication, Testing ] • ICAS (Ice Core Analysis System) for high resolution profiling of • density, grain size, and electrical conductivity [ECM] • design is complete and drawings are 35% complete • 40% of parts have been acquired or fabricated • Fabrication of the Speedograph (in situ, continuous density profiling) • design is complete and technical drawings are 20% complete • 10% of parts have been acquired or fabricated • - Conventional density measurements (for calibration) • design is complete and technical drawings are 10% complete • 10% of parts have been acquired or fabricated • Year 2 Objectives [Continue Fabrication and Testing] • Testing all three devices with firn cores on hand at OSU • Density calibration and Inter-lab comparison (Japan or AWI) • Year 3Objectives [field testing and equipment modification] • - Field test ICAS and Speedograph {Greenland] • Make required refinements identified by field tests • Analyze selected core sections by conventional methods to validate ICAS • observations and confirm annual layer (net accumulation) interpretations • using standard approaches (dust, d18O,major ions) Research Personnel Ellen Mosley-Thompson Victor Zagorodnov Lonnie G. Thompson Ping-nan Lin 1 graduate student who will analyze the physical properties of firn / ice (calibration studies) anticipated to start Sept 2006
To place ongoing changes on Greenland outlet Glaciers in a broader historical perspective, we will be measuring trimline elevations of selected outlet glaciers and estimate the volume of ice lost since the Little Ice Age maximum. To gain better understanding of the bed characteristics under fast-moving ice streams, we will develop DEMs of paleo ice streams on the Canadian shield, and compare these with bed topography of modern active ice streams. Geomorphology mapping from satellite imagery and aerial photographs • Schedule • Year 1 Objectives: • Produce 3D map of the trimline in Jakobshavn Isfjord based on existing aerial photographs • Identify regions on the Canadian shield suitable for the study of paleo ice streams and collect satellite data images (Aster, IceSAT) Year 1 Accomplishments: • Create land-cover map from Landsat ETM+ and ASTER imagery, Jakobshavn Glacier • Assess accuracy of land-cover maps by comparison with aerial photographs, geomorphologic maps and field observations (two publications in press) • Create DEM from ASTER and assess its accuracy by aerial photogrammetry measurements, Jakobshavn Glacier • Evaluate effect of subglacial topography on geothermal heat flux, paper in preparation • Year 2 Objectives: • Compare Aster DEM with those derived from aerial photogrammetry • Produce 3D map of the trimline of Jakobshavn and Kangerlussuaq glaciers, estimate volume loss since LIA • Produce DEM of paleo ice stream • Assess importance of geology on the occurrence of ice streams (sediment availability, erodibility of bedrock, geothermal heat flow) • Research Personnel: • Kees van der Veen • Bea Csatho • Toni Schenk Student Personnel: • Kyung In Huh • Yushin Ahn • 1 potential graduate student
Education and Outreach Our vision is to educate students about the fundamental principles of earth science and the unique role of the polar regions in earth systems. Our objective is to train students who will be able to critically and creatively apply these principles in their chosen careers. CReSIS outreach will be integrated into regular BPRC activities that include annual visits by primary and secondary school students from Central Ohio. BPRC also hosts student groups from local colleges and teacher organizations. BPRC is working with McGraw Hill Company to increase access to polar science information. Schedule Year 1Objectives ECSU presentations Continue discussions with McGraw Hill and production of K-12 material Proposal to establish UG/G track in cryospheric science at OSU Lonnie Thompson web-cast lecture Year 1 Accomplishments 2 undergraduate students hired into RSL ECSU/Haskell presentations Discussions with McGraw Hill Lonnie Thompson web-cast lecture Numerious visits by K-12 students, teachers, parents, college students and teachers Submitted a proposal to Batelle to host 3 day-long climate change sessions (k-12, grad/undergrad and grad, general public) Submit proposal to GLOBE RFP (energy budget focus) Year 2 Objectives Lonnie Thompson participation in Dole Center Workshop Polar Science Seminar Teacher Workshop K-12 Climate Lesson Development Web Enhancement to make educational materials available Produce educational material in collaboration with McGraw Hill Pending approval implement Battelle funded quarterly workshops Pending approval, implement GLOBE proposal on energy budget (remote teacher workshop and student investigations) • C. Landis • All Senior OSU Faculty and Staff • BPRC Administrative Staff
Students • Jan Wuite: Grad Student, glacier dynamics using feature retracking and InSAR velocities (NASA Fellow) • Kyung In Huh: Grad Student, glacier geomorphology (NASA Fellow) • Karl Leibfacher: senior; velocity from AMM-1 and MAMM feature retracking (CReSIS funded) • Stacey Westfall: senior; data rescue/reformatting of ERS/JERS SAR InSAR data (CReSIS funded) • Two graduate student admitted for fall and nominated for OSU Presidential Fellowship (acceptance TBD). AMM-1/MAMM Feature retracking
CReSIS Partners Talks • Haskell – Feb. 23 (Jezek) • ECSU – March 06 (Jezek) • CRESiS Seminar presentation March 9, 2006. In preparation. (Zagorodnov V., E. Mosley-Thompson) • Dole Center Workshop – April 06 ( L. Thompson)
CReSIS Related Publications Mosley-Thompson, E., C. R. Readinger, P. Craigmile, L. G. Thompson, and C. A. Calder. 2005. Regional sensitivity of Greenland precipitation to NAO variability, Geophysical Research Letters, 32, L24707, doi:10.1029/2005GL024776. Raymond, C.F., G.A. Catania, N. Nereson, and C.J. van der Veen, Bed radar reflectivity across the north margin of Whillans Ice Stream and implications for margin processes. Journal of Glaciology, in press. Van der Veen, C.J., K.C. Jezek, and L. Stearns, Shear measurements on three West Antarctic ice streams: 1. Whillans Ice Stream. Journal of Glaciology, submitted. Van der Veen, C.J. and B. Csatho, accepted. Spectral characteristics of Greenland lichens, Geographie et Physique Quaternaire. Csatho, B., C.J. van der Veen and C. Tremper, accepted. Trimline mapping from multispectral Landsat ETM+ imagery. Geographie et Physique Quaternaire Zagorodnov V., O. Nagornov and L.G. Thompson. 2006. Influence of air temperature on a glacier’s active layer temperature. Annals of Glaciology (Accepted for publication) Leibfacher, K., S. Mather, K. Farness, and K. Jezek, 2006. Minimosaic Offset Investigation. BPRC Technical Report, 196 p.
CReSISOSU – Remote Sensing Progress Report 2006 Surface Flow Field Belgica Mts., Radarsat InSAR
Digital Elevation Models • GEOSAT and ERS radar altimeter DEMS obtained from GSFC • IceSAT DEMS obtained from GSFC • Shape from shading DEM obtained from NSIDC • Shape from shading has the fewest outliers and has been resampled to a 1 km grid • DEMs will be merged to create the best available surface topography
Accuracy Assessment of Merged DEMs • Available DEMs: • (A) Ekholm/Bamber DEM, created from ERS-1 and Geosat satellite radar altimetry, airborne laser altimetry (ATM, PARCA), photogrammetry, InfSAR, digitized maps (Bamber, J.L., S. Ekholm, W.B. Krabill, 2001. A new, high-resolution digital elevation model of Greenland fully validated with airborne laser data. JGR, 106(B4), 6733-6745) • (B) Scambos DEM created from the Ekholm/Bamber DEM by adding details from AVHRR imagery by using shape from shading technique (Scambos, T.A. and T. Harran, An image-enhanced DEM of the Greenland ice sheet. Annals of Glaciology, 34, 291-298) • New DEM: • (C) OSU-06 DEMs created from (A) and (B) grids by adding a correction grid derived from ICESat measurements
Rationale for Creating Merged Products from Existing DEMs and ICESat • Accuracy issues and processing uncertainties related to the ERS-1 and ERS-2 data have been identified. Therefore beging to develop merged products by combining existing DEMs with ICESat data and postpone the generation of a DEM from the point data sets (airborne and spaceborne lidar and satellite radar altimetry) until radar altimetry corrections are fully understood and accuracy studies are finished. So far all experiments suggest that the accuracy of the OSU-06 (C) product (existing DEMs with corrections derived from ICESat) will meet the criteria given for this project for most of the ice sheet except the marginal zone.
Ekholm/Bamber Ekholm/Bamber DEM Statistics of difference between ICESat elevations and DEM: Number of values: 19904 Minimum: -30.83 m Maximum: 22.18 m Mean: 0.18 m Standard deviation: 6.67 m Accuracy agrees well with quoted accuracy of DEM (Bamber et al., 2001) Ekholm/Bamber with IceSAT Tracks
Residual between ICESat elevations and Ekholm/Bamber DEM(obtained by Kriging interpolation of residual)
Ekholm/Bamber DEM + interpolated ICESat residuals Interpolation: Kriging No filtering Statistics of difference between ICESat elevations and DEM elevations after interpolated residuals are added: Number of values: 19904 Minimum: -15.28 m Maximum: 8.58 m Mean: -0.02 m Standard deviation: 1.48 m
Ekholm/Bamber DEM + interpolated ICESat residuals Interpolation: Kriging Filtering of residual grid to remove artifacts using a 11 by 11 Gaussian filter Statistics of difference between ICESat elevations and DEM elevations after interpolated residuals are added: Number of values: 19904 Minimum: -25.00 m Maximum: 13.92 m Mean: 0.11 m Standard deviation: 3.95 m This is not real accuracy measure, since ICESat data were used to create the improved DEM. Accuracy assessment with ATM data is ongoing. Same applies for subsequent examples
Scambos photoclinometry DEM Statistics of difference between ICESat elevations and DEM: Number of values: 19904 Minimum: -20.32 m Maximum: 17.60 m Mean: -0.96 m Standard deviation: 5.81 m
Scambos photoclinometry DEM + interpolated ICESat residuals Interpolation: Kriging No filtering Statistics of difference between ICESat elevations and DEM elevations after interpolated residuals are added: Number of values: 19904 Minimum: -16.99 m Maximum: 10.27 m Mean: 0.02 m Standard deviation: 1.36 m -
Scambos photoclinometry DEM + interpolated ICESat residuals Interpolation: Kriging Filtering: 11 by 11 Gaussian filter Statistics of difference between ICESat elevations and DEM elevations after interpolated residuals are added: Number of values: 19904 Minimum: -19.82 m Maximum: 13.56 m Mean: 0.02 m Standard deviation: 3.42 m
Ekholm/Bamber DEM Photoclinometry DEM Mean +/- standard deviation of difference between ICESat elevations and DEMs Original Interpolated, smoothed ICESat residual added Interpolated ICESat residual added 0.18+/-6.67 m 0.11+/-3.95 m -0.02+/-1.48 m -0.96+/-5.81 m 0.02+/-3.42 m 0.02+/-1.36 m Recommended approach to developing OSU 06 DEM
SAR/InSAR Data • MAMM Radarsat data on order from ASF • ENVISAT data acquisitions planned and requests submitted • Cycle 1 Envisat data being received at OSU • TerraSAR-X acquisitions approved • Modified FOCUS/RAMS software available to process ENVISAT data
Jakobsaven & Kangerlussuaq Ascending Jakobsaven & Kangerlussuaq Descending Peterman Ascending Peterman Descending Approved Envisat Acquisitions
Data Products • Data products including geocoded MODIS images are available to the team at www-bprc.mps.ohio-state.edu/rsl
GLACIAL DYNAMICS CReSIS OSU Progress Report 2006 Spectral characteristics of Greenland lichens and Trimline mapping from multi-spectral Landsat imagery B. Csatho C.J. van der Veen C. Tremper In Press, Geographie et Physique Quaternaire
Classified Landsat Imagery Ice Melting ice, snow, firn Supraglacial lakes, brash ice Turbid water Moderately turbid water Slightly turbid water Clear water, shadow Lichen-dominated vegetation Tundra-dominated vegetation Dry sediment Wet sediment Trimzone, sediment, some vegetation Trimzone, sediment, no vegetation Debris-covered ice
Trimline location from Landsat classification and ground GPS survey
Spectral properties of major landcovers Lichen: “An association of a fungus and a photo synthetic symbiont, resulting in a stable thallus of specific structure”
Bare rocks Lichen-covered rocks
Intermittent retreat of Jakobshavns Isbræ since the LIA maximum
Elevation on WGS-84 (meter) 3 5 0 Trimline Airborne laser 3 0 0 2 5 0 2 0 0 ? 1 5 0 1 0 0 5 0 0 1 8 6 0 1 8 8 0 1 9 0 0 1 9 2 0 1 9 4 0 1 9 6 0 1 9 8 0 2 0 0 0 2 0 2 0 Date (year) Surface elevation changes since the LIA; dating based on historical photographs, satellite images, and lichenometry
Firn Core Chemistry and Physics Progress Report 2006
Ice core processing schema: Split: 60/40% with high speed horizontal band saw Band saw design Band saw in cold room
Ice core processing schema (continued): Conventional analysis: • density (calibration) • grain size (calibration) • stable isotopic ratios • major ions • microparticles (dust) Milling Milling spindle-motor
Optical sensors: sample section thickness Two industrial proximity sensors; Resolution ~ 40 m Snow-ice section; ~ 10 mm Proximity sensors
Optical high resolution density sensors (ice core longitudinal scan): - light absorption and scatter (λ1), - light scatter (λ2) Ref PbS detector Signal PbS detector Combiner for laser beams Positioning slides with spindle motor and laser sensors; tested prototype device
Speedograph 1. Hot point drill: - power, 1.0 Kw - length, 0.8 m - weight, 5 kg - diameter, 35 mm - penetration rate = 9-12 m/h 2. Winch, 50 m, 3. Controller, 4. PC data acquisition: - depth - penetration rate - bit pressure - tip power - temperature 5. Power generator, 6. Shelter Encoder well Load cell Slip ring Winch front view Winch side view Hot point drill