Download
1 / 19
200 likes | 384 Views
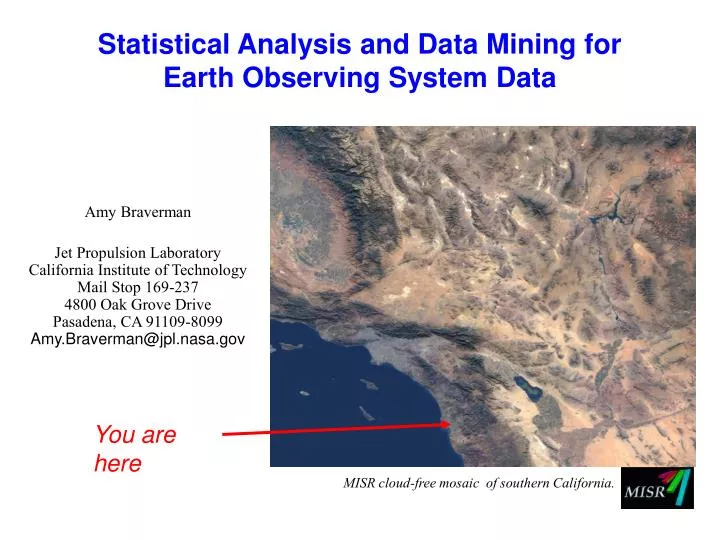
You are here. Statistical Analysis and Data Mining for Earth Observing System Data. Amy Braverman Jet Propulsion Laboratory California Institute of Technology Mail Stop 169-237 4800 Oak Grove Drive Pasadena, CA 91109-8099 Amy.Braverman@jpl.nasa.gov.

E N D
You are here Statistical Analysis and Data Mining for Earth Observing System Data Amy Braverman Jet Propulsion Laboratory California Institute of Technology Mail Stop 169-237 4800 Oak Grove Drive Pasadena, CA 91109-8099 Amy.Braverman@jpl.nasa.gov MISR cloud-free mosaic of southern California.
Outline • Motivation. • MISR instrument. • Data collection and processing. • Example: MISR Level 3 products. • Quantization. • Entropy-constrained vector quantization. • Example: Data Mining MISR Data. • Concluding thoughts. Illustration of multi-instrument composite from Terra. Three-dimensional cloud measurements like those collected by ASTER and MISR. MODIS measures total cloud cover on a daily basis. The 1997-98 El Nino temperature anomaly is visible as red in the Pacific Ocean while the red dots on land show the locations of forest fires.
NASA’s Earth Observing System (EOS) • EOS is a long-term program to study the Earth’s climate “system”. • Missions planned through 2010. • Data to be studied by wide range of researchers at universities and elsewhere. Also used for teaching and policy making. • Data from different instruments and platforms intended to be used synergistically. Clouds and the Earth’s Radiant Energy System (CERES) false color image, September 30, 2001.
NASA’s 23 Strategic Questions Earth's Natural Variability and Trends: V1 Is the global cycling of water through the atmosphere accelerating? V2 How is the global ocean circulation varying on climatic time scales? V3 How are global ecosystems changing? V4 How is stratospheric ozone changing, as the abundance of ozone-destroying chemicals decreases? V5 Are polar ice sheets losing mass as a result of climate change? V6 What are the motions of the Earth and the Earth's interior, and what information can be inferred about Earth's internal processes? Primary Forcings of the Global Earth System: F1 What trends in atmospheric constituents and solar radiation are driving global climate? F2 What are the changes in global land cover and land use, and what are their causes? F3 How is the Earth's surface being transformed and how can such information be used to predict future changes? Responses of the Earth System to Natural and Human-Induced Disturbances: R1 What are the effects of clouds and surface hydrologic processes on climate change? R2 How do ecosystems respond to environmental change and affect the global carbon cycle? R3 Will climate variations induce major changes in the deep ocean? R4 How do stratospheric trace constituents respond to climate change and chemical agents? R5 Will changes in polar ice sheets cause a major change in global sea level? R6 What are the effects of regional pollution on the global atmosphere, and the effects of global chemical and climate changes on regional air quality? Consequences of Changes in the Earth System for Human Societies: C1 How are variations in local weather, precipitation and water resources related to global climate change? C2 What are the consequences of land cover and land use change? C3 To what extent are changes in coastal regions related to climate change and sea-level rise? Prediction of Future Changes in the Earth Climate and Global Environment: P1 To what extent can weather forecasting be improved by new global observations and advances in satellite data assimilation? P2 To what extent can transient climate variations be understood and predicted? P3 To what extent can long-term climatic trends be assessed or predicted? P4 To what extent can future atmospheric chemical impacts be assessed? P5 To what extent can future atmospheric concentrations of carbon dioxide and methane be predicted?
9 view angles at Earth surface 4 Spectral bands (R,G,B,Nir) 7 minutes to view each scene from all 9 angles flight direction ~7 km/sec Altitude 704 km 70.5º Da 60.0º 45.6º 26.1º Ca 0.0º Ba 26.1º Aa 45.6º 60.0º An 70.5º 2800 km Af Bf Cf 275 m spatial resolution per pixel ~400-km swath width Df Multi-angle Imaging SpectroRadiometer (MISR)
1 block= 1.1 km pixels 275 m pixels Multi-angle Imaging SpectroRadiometer (MISR) 180 blocks per swath Space Oblique Mercator projection 233 unique paths in 16-day repeat-cycle of Terra orbit 36 measurements per pixel
Data Production • Data processing at the DAAC. • Software designed, written, and tested at JPL. • Level 1 is coregistered and calibrated. • Level 2 based on physics. • Level 3 is statistics. • Level 4 is many things.
Data Production Level 3 Problem:how to construct a smaller, simpler global data products which will be “good” for a variety of users and analyses? • Earth Observing System satellites return “massive” data volume. • Traditional approach to data exploration: produce maps of one degree averages and standard deviations for each parameter of interest. • Good news: this is easy, practical, and everybody understands it. • Bad news: the method throws away almost all of the distributional information in the data including covariance and higher-order statistics. • New approach: produce an estimate of the joint (empirical) probability distribution of variables of interest within each one degree grid cell; provide all 64,800 grid cell estimates. • Provides a “data minable”, reduced data set.
ECVQ loss: K-means loss: Algorithm d computed here is conditional on quantizer
Data Mining MISR Data An red intensity Df An Da Orbit 1155, blocks 55-65, March 2000
[43,-80] [44,-80] [45,-80] [46,-80] MISR Data Analysis
MISR Data Analysis [46,-80] [45,-80] [44,-80] [43,-80]
MISR Data Analysis Some questions we hope to answer: • How do these 36-dimensional distributions change as a function of location (and time)? • What accounts for outliers? • What physical processes account for differences between grid cells expressed by these distributions? • Are our Level 2 algorithms producing results consistent with what we see here? • Can we train on known examples of certain phenomena, and use distributional similarities to find other cases?
EOS Data Analysis Some questions we hope you can help us answer: • Can streaming processing help us access underlying data (e.g. Level 1 or 2) more efficiently? • Can streaming processing provide for more efficient dissemination of these data to the research community? • Can spatio-temporal databases and streaming data mining techniques they facilitate help us find unusual phenomena we don’t already know about? • How can this technology help increase scientific return from analysis of these data?
Concluding thoughts • There are many exciting opportunities for data mining and statistical analysis of EOS data. The approach described in this talk is just one. • Cutting edge data mining technology has a foothold in the Earth science data analysis community, but has not made its way into the data production infrastructure. There is much to be gained in bridging this gap, and viewing the two activities as related. • One way to make this happen is to establish collaborative relationships between data mining researchers and NASA scientists working on missions. (Note: this will be a long process, and will begin as an unfunded one.) • We welcome your participation! (Suggestion: involve your favorite statistician- they can help bridge the gap between science and computer science.) • MISR web site: http://www-misr.jpl.nasa.gov.