Download
1 / 39
390 likes | 530 Views
Schedule of the project. Start of IPY observations and model runs: 1 March 2007 Publication of modeling challenge paper (‘Ionospheric Challenges of the IPY’, Sojka et al, EOS, 88(15), 171, 10 April 2007) Model-observation workshop at the CEDAR meeting, June 24-29, 2007, in Santa Fe, NM.

E N D
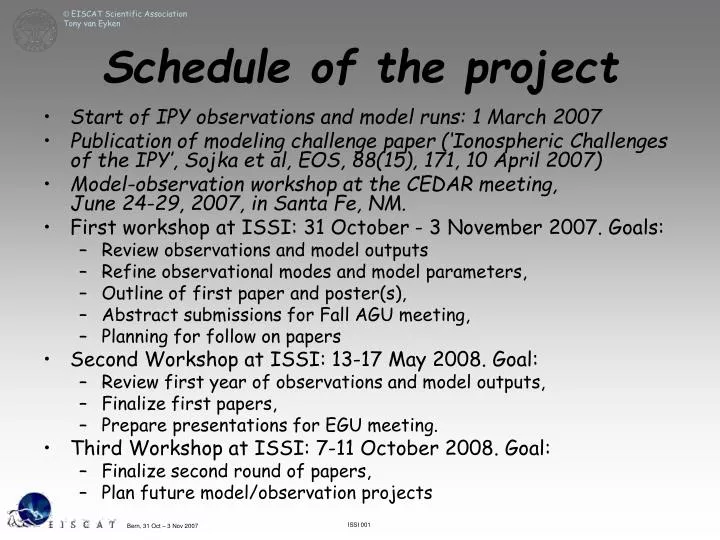
Schedule of the project • Start of IPY observations and model runs: 1 March 2007 • Publication of modeling challenge paper (‘Ionospheric Challenges of the IPY’, Sojka et al, EOS, 88(15), 171, 10 April 2007) • Model-observation workshop at the CEDAR meeting, June 24-29, 2007, in Santa Fe, NM. • First workshop at ISSI: 31 October - 3 November 2007. Goals: • Review observations and model outputs • Refine observational modes and model parameters, • Outline of first paper and poster(s), • Abstract submissions for Fall AGU meeting, • Planning for follow on papers • Second Workshop at ISSI: 13-17 May 2008. Goal: • Review first year of observations and model outputs, • Finalize first papers, • Prepare presentations for EGU meeting. • Third Workshop at ISSI: 7-11 October 2008. Goal: • Finalize second round of papers, • Plan future model/observation projects ISSI 001
Draft Meeting plan • This is a workshop so I suggest just an initial outline and some goals; both can change as we go along of course. • We have four full days of peace and quiet to exploit the data and modelling efforts and really advance our joint project. • We have lots of people, lots of expertise, lots of resources: I believe we could complete the first paper to a point ready to submit during the workshop. • Reaching our goals from the first meeting by the end of this meeting would be both an entirely adequate goal and an entirely adequate outcome. ISSI 001
Tuesday 13 May • Morning break 1045-1115, Lunch 1300-1400, end 1745 (wine) • Introduction (Team Leader: Tony van Eyken) • Review of work completed since the first workshop (30 October – 3 November 2007) • Presentations from each team member • Review of the first year of the International Polar Year operation with particular emphasis on the incoherent scatter radars and modelling • Revision of the Workshop plan • Update website - http://www.issibern.ch/teams/effective-physics ISSI 001
Wednesday 14 May • Morning break 1045-1115, Lunch 1300-1400, end 1800 • Morning • Introduction (Team Leader) • Review of work completed since the first workshop (30 October – 3 November 2007) • Presentations • Round table comments • Presentations: Jan, Pierre-Louis, John, … • Group discussions on developing publications as started at the first workshop • What do we need GC/MC to do this week? • Selection of papers, leaders, groups for this workshop • Afternoon • Parallel working groups on specific papers and projects • Date of next meeting ISSI 001
Thursday 15 May • Morning • Group activity • Identification of new publications/projects • Afternoon • Group discussions on developing projects • 2 groups generally as yesterday with HC and JS • Planning and distribution of tasks for the next meeting • Outline of Workshop Report • ISSI forms for those leaving today • (Professor Lennart Bengtsson) • First Team members depart (evening) ISSI 001
366 days ESR ISSI 001
Mihail Codrescu re CTIPe runs • … • Right now I have results from June 2007 to the present. However, I have been playing with the code and the results are not consistent. I am in the process of re-tuning the model. This is necessary because I am using a new function of ACE data instead of NOAA POES data to characterize particle precipitation at high-latitudes. This is a critical input as it controls Joule Heating. NOAA POES data come 3 hours late and I want a real time run! • Also, most of the older results are at one hour cadence. The present run (since March) is at 15 min cadence. • I tried very hard to do a consistent run for the year but various things like my playing with the code, storage space, and machine differences slowed me down. I intend to have results for the whole year as soon as possible, hopefully by CEDAR. • I just received the CD with measurements from Jan. I did not look at the numbers yet. • Can you guys tell if the CTIPe is cold or hot at EISCAT and Poker? • Wishing I were in Bern… ISSI 001
Geof Crowley re Paper 3 Joule Heating • Here is an outline and some thoughts about the Joule Heating paper, Sorry I couldn’t be with you. • Science Question: Is the fact that the 1st principles models have bigger Ti-Tn than Jan’s model simply due to the fact that we have more variability in our convection patterns? • Figure 1: Difference between Ti -Tn for Svalbard radar, PFISR, Millstone. Probably show the same altitude vs UTtime profiles for TN, TI and difference, so there’d be 3 panels per radar. This could be altitude vs UTtime for 6-months, or for a year, or choose 1 month. • Figure 2: Difference between Ti -Tn for TIMEGCM, Mihail’s model, Jan’s model Same as above. • Figure 3 - Then focus on individual quiet and disturbed days, Te, Tn, etc to illustrate. For the radars: What is relative magnitude of Ti – Tn for quiet times versus active time? (add plot of Kp vs time) • Figure 4: Geoff could do a scatter plot of Joule htg vs Ti-Tn for each radar location (fixed altitude) Winter versus summer, etc? • Figure 5: How does it vary with height? • Figure 6: What is difference between model and radars? • Figure 7: Will compare AMIE Joule Heating with that from TIMEGCM. • During quiet times, do we find that Ti = Tn because the high latitude forcing is small. How much do we think the forcing from below will cause Ti increases. Generally might expect it to be small. • This is a follow-up from the mention in Paper-1 that Ti > Tn at higher latitudes. This is not the ‘common-sense’ of the community, who thinks that Ti=Tn below some altitude. In fact what we find is a monotonic increase of Ti AND Tn, with Ti > Tn. • May include a discussion of exactly what is Joule and frictional heating (Herb see paper by Semeter and Thayer for excellent discussion) • Discussion of charge exchange and whether it is an important part of collision physics. Why is the neutral-neutral collision cross section different from the ion-neutral collision cross-section? ISSI 001
Things from yesterday • Block diagram following P-L ideas • More on conjugate paper • Composition: model from ionosonde F1 could be used as input for ISR analysis to derive better temperatures • Much more on Paper 1 • Structuring of project in two general areas of ‘how to get therosphere right’ and ‘reasons why not right’ • Modelling based on PFISR and ESR datasets can be extended to test if compatible with Sondrestrom, Millstone, Irkutsk, EISCAT UHF, etc • Radar data issues • ‘Hairy’ temperatures (floor at ESR, ceiling at PFISR) • HmF2 • ESR: geomagnetic parameters updated • Binning • Web site • Links from main ISSI and IPY pages to our group • Names and contact details • French, Chinese and UK model links ISSI 001
Friday 16 May • Morning • Parallel working groups on specific papers and projects • Afternoon • Parallel working groups on specific papers and projects • More Team members depart (evening) ISSI 001
Saturday 17 May • Wrap up and departure of remaining Team members ISSI 001
Goals • The goal of the proposed work, with the aid of three workshops at ISSI, is to capitalise on the unique opportunity represented by the huge increase in data availability during the International Polar Year (IPY) of 2007-9 to dramatically improve the quality of models, and the underlying physical understanding, and in particular to develop their capabilities in now- and fore-casting. • We propose to concentrate on two main threads, the first related directly to the development of the model-data comparison and model improvement, and the second related to understanding some of the important classes of phenomena revealed by the observational and modelling programs. • The plan is to use the year-long ISR runs not just to validate the physics of high latitude ionospheric models, but also as input data for assimilation models. ISSI 001
For the modelling work we will attempt to: • Create model predictions for the year-long observations • Compare these predictions with the observations and each other to identify model and theory challenges • Upgrade and improve the models and refine the observations during a series of focused ISSI workshops, allowing real improvements in repeats of the prediction-comparison cycle Specific model related issues to be addressed include: • Improve the representation of tides in the models • Examine how global dynamics depends on gravity wave parameterizations • Examine what middle and low latitude effects (dynamic and chemical) depend on high-latitude storm time inputs • Better evaluate the effective Joule heating from magnetospheric inputs and the role ion drag plays in modifying that heating. • Evaluate the importance of global electrodynamical coupling to the response of the neutral atmosphere to auroral events. • Examine how well quantitatively current thermosphere-ionosphere models reproduce steady-state quiet time dynamics of the atmosphere globally For the related studies, we intend to develop improved understanding of: • The relative importance of the sunlit, aurora precipitation ionization and ionospheric convection in the polar ionosphere, particularly with respect to the resulting variability in F2 region plasma dynamics • The day-to-day and seasonal variation of the polar ionosphere and the interaction between the thermosphere and ionosphere. • The role of cusp dynamics in the formation of polar cap patches. • The drivers and occurrence of polar cap patches in the northern and southern hemispheres, the latter using ionosonde observations made at Zhongshan station • The polar ionospheric response to Storms and Substorms • The role and importance of field-aligned currents in the high latitude ionosphere and magnetosphere. ISSI 001
Paper 1 • TvE to lead • Target is JGR • ESR/PFISR/Sondrestrom/Millstone Hill/Sondankyä(/Irkutsk?) • Figure 1 with all Ne data from four radars + Sodankylä ionosonde (5 data sets) • 240-day data plots • Models: ASPEN, CTiPc, USU (3 data sets) • All work done and all components available • Jan to check/encourage work • Set up to ingest data to MADRIGAL • Models to be run by AGU (takes ~1.5 months) • Calibrate altitudes (match E-layer altitude) • Components to be sent to Tony (Tony and Herb to write) • Next version ready by AGU ISSI 001
Common data views • Models: Weekly files • Vertical datasets • Data format to be agreed between Millstone and model data providers • Coverage: 100-600km • 100(4)116km, 116(8)220km, 220(16)440km, 440(32)600km • Interval: 15 minutes • Parameters: Ne, Te, Ti, Tn, O+/Ne, NO+/Ne, O2+/Ne, [N2], [O2], [O], NmaxF2, hmF2, TEC(100-600km) • Model runs to be generated for fixed set of stations (Tony to check positions and confirm to everyone): • Longyearbyen (78.2N, 16.1E) • PFISR (65.1N, 147.4W) • Sondrestrom (67.0N, 309.0E) • Millstone Hill (42.6N, 71.5W) • Sodankylä (67.3N, 26.6E) • Tromsø (69.6N, 19.2E) • Irkutsk (52.9N, 103.2E) ISSI 001
Paper 2: Ionospheric variability over 240 Days • Millstone/MC take lead • Statistics: weather v. climatology over 240 days • Variance of models v variance of data? Are the models producing variability which matches observation?inputs) • Exploits all ISR parameters • What needs to be done? • Uses same 15 minutes model data as paper 1 • Averages to be calculated? • MC to circulate some suggestions • Time scale? • Starts as model data sets become available • Paper draft for consideration at the next meeting • Tasks? • Proof of concept via MADRIGAL, John/Bill (with PFISR and EISCAT inputs) ISSI 001
Paper 3: Role of Joule heating • GC/HC/YR to lead • Joule heating: comparison between models across the year – comparison with data • Effect of high latitude heating drivers, ‘steady state’ and multiple transient events • Then focus on individual quiet and disturbed days, Te, Tn, etc to illustrate • Difference of temperatures shown by the different models due to inclusion of variability? • What needs to be done? • Models: need to save Joule heating information as height integrated values plus detailed altitude profiles for selected (~week) intervals. • Time scale? • Data available: February • Paper outline for next meeting • Tasks? • Herb: circulate comment on heating processes ISSI 001
Paper 4: next time • Long quiet stretch (October 2007) • ESR, EISCAT UHF (Finnish campaign), Millstone, Sondrestrom, PFISR • Magnetosphere not the primary source • What needs to be done? • Time scale? • Tasks? ISSI 001
Paper 5: Correlation between observed data and recorded geomagnetic indices • Lead: YR/SZ/MN/TU • Study based on data available in MADRIGAL • Geomagnetic drivers: does data (ESR and PFISR) show correlation with accepted geomagnetic drivers over extended time intervals? • For example: does magnitude of Kp match the variability seen in the data? • Continuity of the record over 240+ days is unique feature • Use integrated (weighted?) indices for comparisons • Time constants/delays: differences between ESR and PFISR? • What needs to be done? • Get PFISR data into MADRIGAL • Time scale: first draft to be written at next meeting • Tasks? ISSI 001
Field-aligned currents? • Lead: GC/UPL • Event list from UPL • Run AMIE for those events (GC) • Correlation? ISSI 001
Web page • Pictures for other data providers (with links to data in MADRIGAL ISSI 001
Paper 6 • Effects of solar input, plus tides and waves in the E-region • Different illumination angles at the different data providers • 30-day runs long enough to see waves and tides • Two-week data runs don’t work for day-night variations ISSI 001
Goals/changes for next workshop • 13-17 May 2007: 0900 start, arrive evening 12 May, depart 17 May • Team and travel locked in earlier • Ban on network connections for some hours each day? • First floor if possible • Space for sightseeing: trip? • Evening sessions (early dinner as a group) • Half days (not AGU style) on: • patches • field aligned currents • Physics issues behind models ISSI 001
Work before next meeting • Task allocations • Monthly nagging emails from Tony ISSI 001
Other things to do • Now • Information and data to be distributed around the group? • Review goals of the working group • Keep the long run going • Change observing modes for data providers now, for second year? • Two week observations don’t provide enough for studies of long quiet periods • Resolute Bay radar’s role? • Too many papers/projects? Add more people? • Too many topics? Spin off other workshops/groups? • After this meeting • Tony: exploit publicity possibilities of this meeting • Tony: collect missing CVs and adjust the team composition • GC: Ingest ESR (and other ISR) data into AMIE: MADRIGAL • All: send Tony summary view of this meeting and proposals for the next workshop • Tony: Summary of first meeting • All: Material to Jan for AGU PFISR invited talk by 1 December • All: MADRIGAL related material to John for AGU poster ISSI 001
Yesterday • Most of the day catching up to where we left off last time • Papers 1, 2, 3, 5 seen as most important, plus a new paper 7 addressing conjugate data (particularly ionosonde data) • Importance of composition • Field-aligned flows and outflows • Change all references to 240 days to 365 • Discussion of possible future Antarctic ISR locations ISSI 001
Paper 1 • TvE to lead • Target is JGR • ESR/PFISR/Sondrestrom/Millstone Hill/Sondankyä(/Irkutsk?) • Figure 1 with all Ne data from four radars + Sodankylä ionosonde (5 data sets) • 365-day data plots • Models: ASPEN, CTiPc, USU (3 data sets) • What needs to be done? • Time scale? • Paper outline by end of this meeting • Tasks? • Components to be sent to Tony (Tony and Herb to write) ISSI 001
Common data views • Models: Weekly files • Vertical datasets • Data format to be agreed between Millstone and model data providers • Coverage: 100-600km • 100(4)116km, 116(8)220km, 220(16)440km, 440(32)600km • Interval: 15 minutes • Parameters: Ne, Te, Ti, Tn, O+/Ne, NO+/Ne, O2+/Ne, [N2], [O2], [O], NmaxF2, hmF2, TEC(100-600km) • Model runs to be generated for fixed set of stations (Tony to check positions and confirm to everyone): • Longyearbyen (78.2N, 16.1E) • PFISR (65.1N, 147.4W) • Sondrestrom (67.0N, 309.0E) • Millstone Hill (42.6N, 71.5W) • Sodankylä (67.3N, 26.6E) • Tromsø (69.6N, 19.2E) • Irkutsk (52.9N, 103.2E) ISSI 001
Paper 2: Ionospheric variability over 365 Days • Statistics: weather v. climatology over 365 days • Variance of models v variance of data? Are the models producing variability which matches observation?inputs) • Exploits all ISR parameters • Uses same 15 minutes model data as paper 1 • Averages to be calculated? • What needs to be done? • Time scale? • Paper outline by end of this meeting • Tasks? ISSI 001
Paper 3: Role of Joule heating • Joule heating: comparison between models across the year – comparison with data • Effect of high latitude heating drivers, ‘steady state’ and multiple transient events • Then focus on individual quiet and disturbed days, Te, Tn, etc to illustrate • Difference of temperatures shown by the different models due to inclusion of variability? • What needs to be done? • Time scale? • Paper outline by end of this meeting • Tasks? ISSI 001
Paper 4: next time • Long quiet stretch (October 2007) • ESR, EISCAT UHF (Finnish campaign), Millstone, Sondrestrom, PFISR • Magnetosphere not the primary source • What needs to be done? • Time scale? • Tasks? ISSI 001
Paper 5: Correlation between observed data and recorded geomagnetic indices • Study based on data available in MADRIGAL • Geomagnetic drivers: does data (ESR and PFISR) show correlation with accepted geomagnetic drivers over extended time intervals? • For example: does magnitude of Kp match the variability seen in the data? • Continuity of the record over 365 days is unique feature • Use integrated (weighted?) indices for comparisons • Time constants/delays: differences between ESR and PFISR? • What needs to be done? • Get PFISR data into MADRIGAL • Time scale: first draft to be written at this meeting • Tasks? ISSI 001
Field-aligned currents? • Lead: GC/UPL • Event list from UPL • Run AMIE for those events (GC) • Correlation? • What needs to be done? • Time scale? • Tasks? ISSI 001
Web page • Update daily • Yvonne ‘volunteered’ ISSI 001
Paper 6 • Effects of solar input, plus tides and waves in the E-region • Different illumination angles at the different data providers • 30-day runs long enough to see waves and tides • Two-week data runs don’t work for day-night variations • What needs to be done? • Time scale? • Tasks? ISSI 001
Paper 7 • Conjugate emphasis • Ionosonde data sets • What needs to be done? • Time scale? • Tasks? ISSI 001
Goals/changes for next workshop ISSI 001
Work before next meeting ISSI 001
Other things to do • Now • After this meeting ISSI 001