Download
1 / 19
240 likes | 417 Views
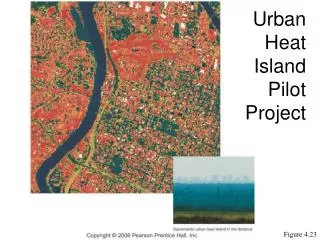
Urban Heat Island. Air temperature measurements: Thermometer is located in the shade at about 1.5 meters above a short grass surface in an open field. Three temperature units: º C, ºF, º K. Diurnal Air Temperature. Surplus means absorbed insolation is higher than outgoing longwave radiation

E N D
Air temperature measurements: Thermometer is located in the shade at about 1.5 meters above a short grass surface in an open field.
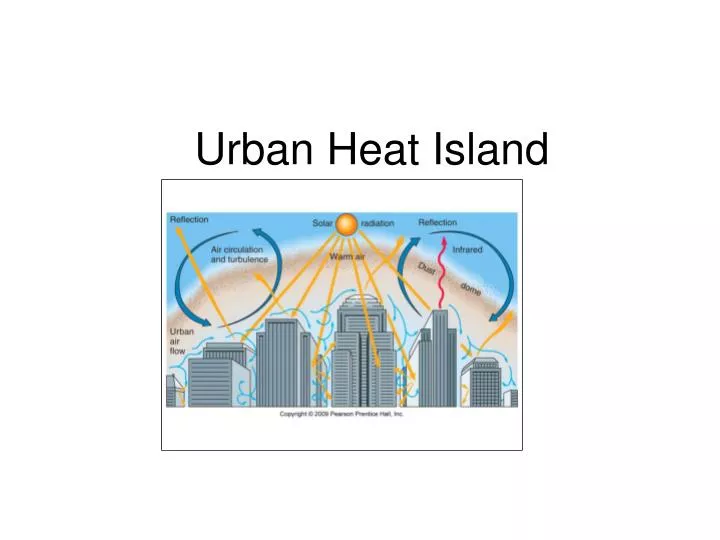
Diurnal Air Temperature Surplus means absorbed insolation is higher than outgoing longwave radiation And thus air temperature increases; Deficit means absorbed insolation is lower than outgoing longwave radiation and thus air temperature decreases.
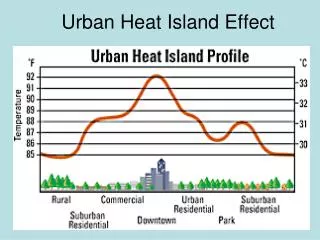
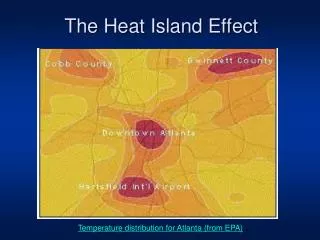
UHI: Urban heat island Intensitydifference between maximum urban center air temperature and background rural air temperature
UHI varies in time and space as result of atmospheric conditions, location, and urban characteristics. (1) UHI reaches maximum at a few hours after sunset, and minimum in the middle of the day
(2) Seasonal patterns of UHI in US cities (summer seems to be the strongest)
(3) UHI Increases with population increase Why N. America has higher rate of increase?
(4) UHI is less during weekend than week days in winter, no difference in summer
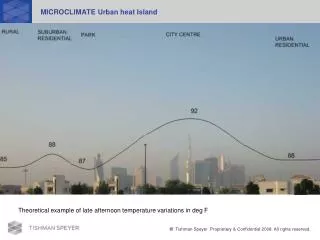
Urban night time temperature is much more likely to be higher Urban day time temperature could be lower in warm season
Vertical structure: Inversion (air temperature increases with height) is more common during night over rural areas while the urban area is almost isothermal and less stable Steep lapse rate (air temperature decreases with height) is found in strong UHI city during day. Urban Rural
Impact of wind (Fig 5.21) UHI decreases with increasing wind speed. Different city has different threshold for urban heat island to disappear. For example, critical wind speed for breaking up UHI is about 10m/sec at 10 meter rural site (for 1 million population) (smaller for smaller town) Ideal condition for UHI: weak wind, cloudless sky.
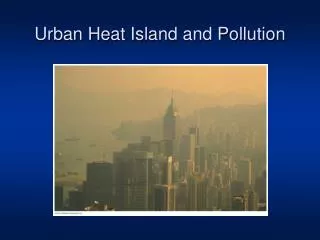
Causes of canopy layer of urban heat isle • increased RL↓ due to absorption of RL↑ and re-emission by pollution • decreased net RL ↑ loss from canyons due to reduction in sky-view factor by building. • greater shortwave absorption due to effect of canyon geometry on albedo • greater day heat storage due to thermal properties of urban materials and its nocturnal release. • anthropogenic heat from buildings • decreased evaporation due to removal of vegetation and surface “water proofing” of city • decreased loss of sensible heat due to reduced winds in canopy.
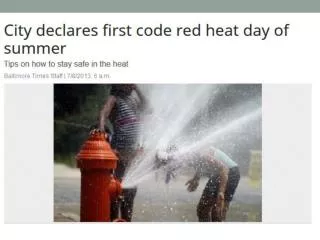
High Pressure and Urban Heat Island Spells Disaster! The heat wave in July 1995 in Chicago was one of the worst weather-related disasters in Illinois history with approximately 525 deaths over a 5-day period. STATION: CHICAGO_MIDWAY_AP_3_SW, IL (Station ID: 111577) Precip- |<--temperature->| itation High Low Mean Year Mo Dy (in) (F) (F) (F) 1995 07 01 0.00 77 60 69 1995 07 02 0.00 78 57 68 1995 07 03 0.00 83 63 73 1995 07 04 0.28 86 69 78 1995 07 05 0.09 87 67 77 1995 07 06 0.00 81 69 75 1995 07 07 0.00 81 63 72 1995 07 08 0.00 84 60 72 1995 07 09 0.04 85 66 76 1995 07 10 0.00 90 64 77 1995 07 11 0.00 90 73 82 1995 07 12 0.00 98 76 87 1995 07 13 0.00 106 81 94 1995 07 14 0.00 102 84 93 1995 07 15 0.47 99 77 88 1995 07 16 0.00 94 76 85 1995 07 17 0.00 89 73 81
Heating and cooling degree days Heating degree days: accumulation of all degrees below a certain threshold (65ºF) throughout of a year. Cooling degree days: accumulation of all degrees abovea certain threshold (65ºF) throughout of a year.
On average, HDD is 8% less in cities (46% difference in LA urban and airport; Table 5.8).
Last Freezing date and freeze-thaw cycles Urban has half of the frequency of freeze-thaw cycles in Baltimore, Maryland
Mitigation Measures • Reflective roofing (increase albedo) • Green roofs (increase latent heat)