Download
1 / 24
240 likes | 333 Views
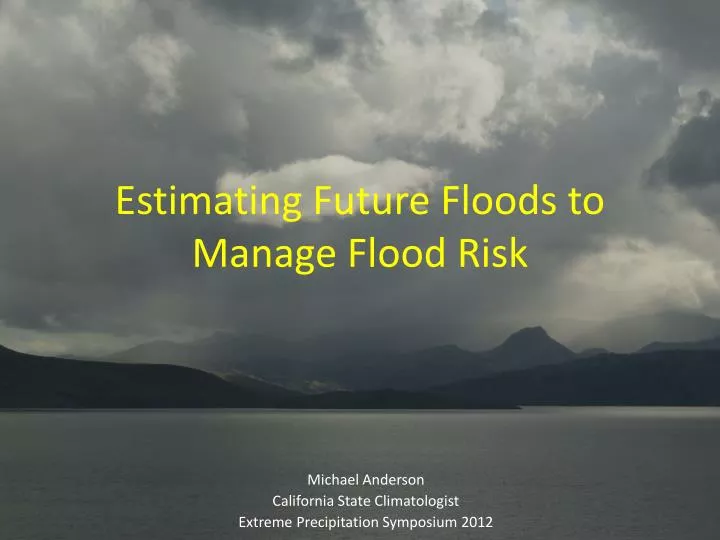
Estimating Future Floods to Manage Flood Risk. Michael Anderson California State Climatologist Extreme Precipitation Symposium 2012. Talk Overview. Statistics Physics Climate Change Flood Management and the 200-year Event Panel Discussion Set-Up . The 200-Year Event.

E N D
Estimating Future Floods to Manage Flood Risk Michael Anderson California State Climatologist Extreme Precipitation Symposium 2012
Talk Overview • Statistics • Physics • Climate Change • Flood Management and the 200-year Event • Panel Discussion Set-Up
The 200-Year Event A State mandated target threshold for flood peak and volume for a critical duration to use for flood management planning for current and future climate conditions
What does a 200-year Event Look Like? Buck’s Creek NOAA Atlas 14 200-Year 3-Day Estimate 23.5 inches (18.4-30.6 inch 90% confidence interval CAT 3 is > 30 cm (12 in) in 3 days Blue Canyon NOAA Atlas 14 200-Year 3-Day Estimate: 24.4 inches (19.1-31.9 inch 90% confidence interval) HMR 58/59 3-Day PMP Estimate : 37.8 inches CAT 5 is > 50 cm (20 in.) in 3 days
California’s Wild Precipitation Regime California precipitation is uniquely variable Std Dev of Annual Precipitation Mean Annual Precipitation Dettinger et al, 2011
American River Feather River How to anticipate, plan and operate to this Given this history Feather River American River
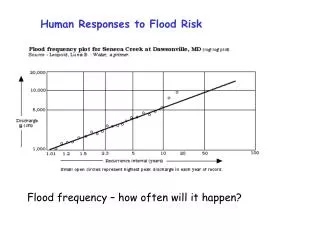
Flood Frequency Curve Rain to top of watershed Snow Level Varies Dry Years
Flooding & water supply Cyclogensis Storm Track changes L Atmospheric River MJO/Tropical Convection ENSO Easterly Wave Key Phenomena Affecting California Water Supply/Flooding: The most extreme CA storm would result from a rare alignment of key processes
From AR Flux to Runoff • How much moisture flux generates how much precipitation? • How much precipitation where generates how much runoff? • Are these relationships static? If not, how do they change and why?
Physical Boundaries • Watershed Size and Elevation • Atmospheric River Event Duration • Atmospheric River Flux Limits • Limits on Flux to Precipitation Conversion Process
Precipitation/TemperatureDistribution Plot Hot/Wet Cold/Wet As distribution shifts, new extremes possible Climate system plays a role in what extremes are possible Some extremes are unique – need to diagnose why Cold/Dry Hot/Dry
Sea Level Rise Slide from Jamie Anderson DWR- Bay Delta
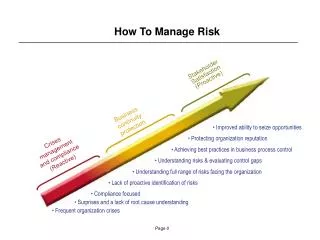
Components of Managing Floods • Monitoring Networks • Reservoirs – Designated Flood Storage and Incidental Flood Space • Levees • Control Structures/Urban Drainage • O&M Considerations • Critical Event Duration Determination
Threshold Analysis Approach Combination of approaches Begin with a “Bottom-up” approach – Vulnerability assessment at critical system thresholds Work at Developing “Top-down” approach to define physical conditions for flood event Source: Dessai and Hulme, 2003
Developing a Strategy • Identify target flood peak, volume, and duration • Identify critical thresholds • Identify timing of transition points • Identify adaptive capacity • Identify capital investments needed for present and future conditions
Adaptive Management for a Changing Climate • Planning Process and Policy • Monitoring Change • Thresholds, Timing, and Transitions • What About Forecasts?
UNCERTAINTY Climate Projections Converting GCM data to watershed scales and event runoff Water cycle changes $$$$ Ecosystem response Future Mandates Future Watershed Conditions Adaptation Strategies Sea level rise Changes in societal values
Questions? Michael Anderson State Climatologist, California California Department of Water Resources manderso@water.ca.gov