Download
1 / 31
310 likes | 399 Views
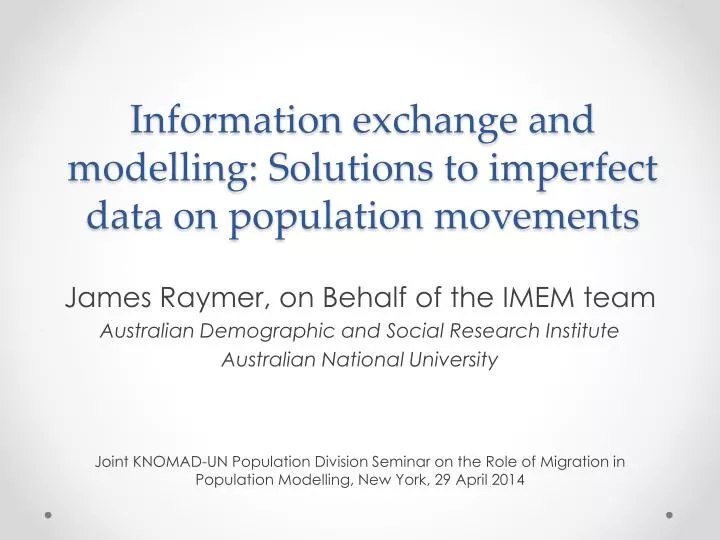
Information exchange and modelling: Solutions to imperfect data on population movements. James Raymer, on Behalf of the IMEM team Australian Demographic and Social Research Institute Australian National University

E N D
Information exchange and modelling: Solutions to imperfect data on population movements James Raymer, on Behalf of the IMEM team Australian Demographic and Social Research Institute Australian National University Joint KNOMAD-UN Population Division Seminar on the Role of Migration in Population Modelling, New York, 29 April 2014
Double-entry matrix for selected countries, 2003 I = Receiving country’s reported flow; E = sending country’s reported flow; … = no reported data available
Double-entry matrix for selected countries, 2003 I = Receiving country’s reported flow; E = sending country’s reported flow; … = no reported data available
Double-entry matrix for selected countries, 2003 I = Receiving country’s reported flow; E = sending country’s reported flow; … = no reported data available
Double-entry matrix for selected countries, 2003 I = Receiving country’s reported flow; E = sending country’s reported flow; … = no reported data available
Introduction • Since 2007, there have been two international and interdisciplinary projects on estimating international migration flows in Europe • MIMOSA funded by Eurostat, 2007-2009 • IMEM funded by New Opportunities for Research Funding Agency Co-operation in Europe (NORFACE), 2009-2012
IMEM project • The project brought together expertise in modelling, data and uncertainty • Southampton Statistical Sciences Research Institute • James Raymer (PI), Jon Forster, Peter Smith, Jakub Bijak and Arkadiusz Wiśniowski • Netherlands Interdisciplinary Demographic Institute • Rob van der Erf, Janette Schoorl and Joop de Beer • University of Oslo • Nico Keilman and Solveig Christiansen
IMEM design • Bayesian model for harmonising and correcting the inadequacies in the available data and for estimatingthe completely missing flows • The methodology is integrated and capable of providing measures of uncertainty • Key aspects of our methodology: • Development of the underlying statistical framework • Elicitation and inclusion of relevant expert prior information • Scope: flows amongst 31 European countries by age and sex, 2002-2008 • Adopted definition according to United Nations 1998 recommendation
Origin-destination (OD) model Expert opinion Expert opinion
Posterior densities of the estimated true migration flows for selected countries, 2006
Median estimates of selected true flows (solid), reported emigration (cross) and reported immigration (circle), 2002-2008
Top ten median flows from Poland, 2002 Rest of world Top ten flows = 93.9% of total (145,988)
Top ten median flows from Poland, 2003 Rest of world Top ten flows = 93.8% of total (145,186)
Top ten median flows from Poland, 2004 Rest of world Top ten flows = 93.6% of total (251,636)
Top ten median flows from Poland, 2005 Rest of world Top ten flows = 93.4% of total (267,065)
Top ten median flows from Poland, 2006 Rest of world Top ten flows = 92.5% of total (253,427)
Top ten median flows from Poland, 2007 Rest of world Top ten flows = 91.8% of total (272,928)
Top ten median flows from Poland, 2008 Rest of world Top ten flows = 91.7% of total (293,059)
Top ten median flows from Poland, 2008 Rest of world Interquartile ranges Total flow: 270,149 - 381,093 ~ 19% +/- from median Red: ~ 28% +/- Green: ~ 10% +/-
Summary • We produced a set of harmonised and complete estimates of migration by origin, destination, age and sex for the 31 countries in the EU and EFTA from 2002-2008 • Some results are available on the internet • http://www.cpc.ac.uk/research_programme/IMEM_project.php • Our plan is to continue improving and expanding the model as new funding and data become available
Contributions of the IMEM project • A methodology for estimating harmonised flows of international migration by age and sex • Integration of a measurement model with covariate information and expert judgments to estimate missing flows • Estimates include measures of uncertainty
Usefulness of an integrated migration estimation system • Single resource for policy making and research • Reference for data validation • Platform for sharing information, harmonising definitions and removing inconsistencies • A data source for countries with inadequate collection systems
Main conclusions • Reported flows on international migration data are highly inconsistent and incomplete • Expert knowledge on data collection systems is needed to understand the reported flows • Real improvements in the data requires information exchange between national statistical offices • In the absence of communication, statistical modelling is necessary to reconcile inconsistent data and to estimate missing data • Uncertainty measures are necessary for understanding the quality of the estimates
Forecasting: Argument for origin-destination migration flow tables • Net migration totals (or rates) do not exhibit regularities across age and space that you can depend on • Forecasts of net migration result in biased population projections • Reported net migration totals are not simply the difference between immigration and emigration; they contain administrative corrections and other unknown quantities • Although more cumbersome, flow tables provide flexibility and access to better checks and validation (e.g., origin-destination migrant stock data)