Download
1 / 19
210 likes | 318 Views
Moisture Variables on Skew T Log P Diagram. AOS 330 LAB 8. List of Variables. Mixing ratio (w) Saturation mixing ratio (w s ) Specific Humidity (q) Vapor pressure (e v ) Saturation vapor pressure (e s ) Relative humidity (RH) Dewpoint (T d ) Dewpoint Depression

E N D
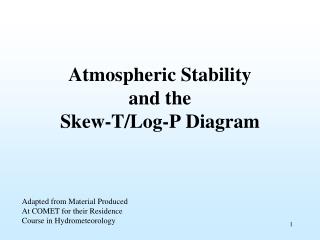
Moisture Variables on Skew T Log P Diagram AOS 330 LAB 8
List of Variables • Mixing ratio (w) • Saturation mixing ratio (ws) • Specific Humidity (q) • Vapor pressure (ev) • Saturation vapor pressure (es) • Relative humidity (RH) • Dewpoint (Td) • Dewpoint Depression • Virtual Temperature (Tv) • Wet-Bulb Temperature (Tw)
Mixing Ratio (w or rv) • Mixing ratio (rv) – a way to tell how much vapor there is relative to a mass of dry air • It is conserved as long as there is no condensation or evaporation. • Units : g kg-1
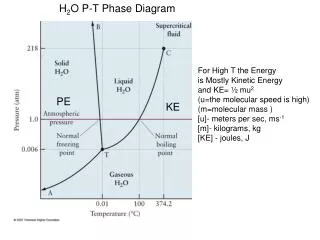
Specific Humidity (q) • Mass of water vapor per unit mass of moist air • But mass of water vapor is very small compare to the total mass (~1-2% of the total mass) • , (ev<< p)
Vapor Pressure (ev) • ev – partial pressure of vapor in (Pa) • es – saturation vapor pressure over plane surface of pure water
Saturation Vapor Pressure (es) • Vapor pressure ev - most directly determines whether water vapor is saturated or not. • ev < es(T) subsaturated, evaporation • ev = es(T) saturated • ev > es(T) supersaturated, condensation • es only depends on temperature. • es(T) increases with increasing temperature.
Relative Humidity • Subsaturated: RH < 100% • Saturated: RH = 100% • Supersaturated: RH > 100% • Depends on both vapor pressure ev and the air temperature T
Dewpoint (Td) • Consider the case ev < es(T), we could always reduce es(T) to ev by lowering the temperature. • Dewpoint is the temperature at which moist air became saturated over a plane surface of pure water by cooling while holding ev constant. • Only depends on the vapor pressure ev.
Saturation Mixing Ratio (ws) • It is the mixing ratio for which air is saturated at specific T and P.
Saturation Mixing Ratio (ws) • Depend on both temperature and pressure • In units of (g kg-1) • If we choose P to be 622 hPa, then
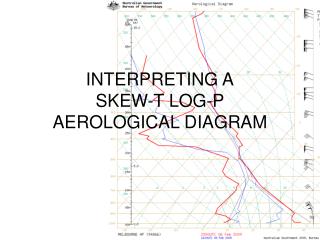
To find saturation vapor pressure (es) 3 deg C 622hPa 7.8 gkg-1 A temperature of 3 deg C at 622hPa is correspond to a saturated mixing ratio of 7.8 g kg-1. The saturation vapor pressure is ~ 7.8 hPa.
Dewpoint, Mixing Ratio, and Dewpoint Depression Td T P w ws
Virtual Temperature (Tv) • To apply ideal gas law to mixture of air and vapor • Moist air equation of state :
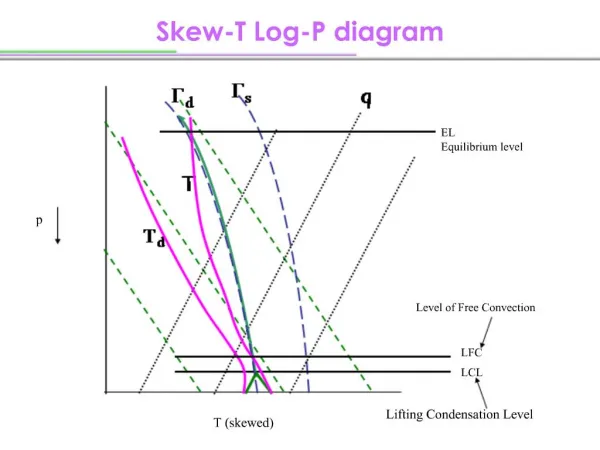
Wet-Bulb Temperature (Tw) • It is the temperature to which air is cooled by evaporation until saturation occurs. • Assume that all of the latent heat of vaporization is supplied by the air • Normand’s Rule: To find Tw, lift a parcel of air adiabatically to its LCL, then follow moist adiabat back down to parcel’s original P
One Other Variable: Θ • Potential Temperature Θ • Temperature of the parcel if it were compressed or expanded dry adiabatically to 1000 hPa. • Conserved in dry adiabatic process
Lifting Condensation Level (LCL) • The level at which a parcel lifted dry adiabatically will become saturated. • Find the temperature and dewpoint of the parcel (at the same level, typically the surface). Follow the mixing ratio up from the dewpoint, and follow the dry adiabat from the temperature, where they intersect is the LCL.
References • Petty, G (2008). A First Course in Atmospheric Thermodynamics, Sundog Publishing. • Potter and Coleman, 2003a: Handbook of Weather, Climate and Water: Dynamics, Climate, Physical Meteorology, Weather Systems and Measurements, Wiley, 2003