Download
1 / 53
530 likes | 638 Views
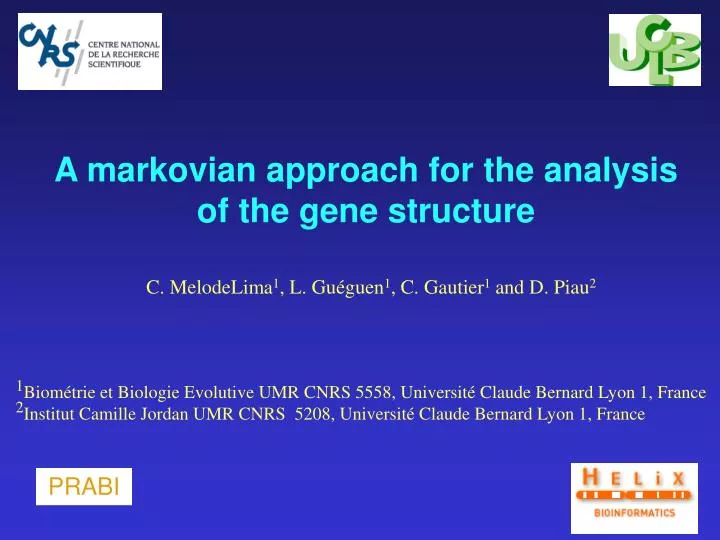
A markovian approach for the analysis of the gene structure. C. MelodeLima 1 , L. Guéguen 1 , C. Gautier 1 and D. Piau 2. 1 Biométrie et Biologie Evolutive UMR CNRS 5558, Université Claude Bernard Lyon 1, France 2 Institut Camille Jordan UMR CNRS 5208, Université Claude Bernard Lyon 1, France.

E N D
A markovian approach for the analysis of the gene structure C. MelodeLima1, L. Guéguen1, C. Gautier1 and D. Piau2 1Biométrie et Biologie Evolutive UMR CNRS 5558, Université Claude Bernard Lyon 1, France 2Institut Camille Jordan UMR CNRS 5208, Université Claude Bernard Lyon 1, France PRABI
Conclusion • Direction of research Contents • Introduction • HMM for the genomic structure of DNA sequences • Discrimination method based on HMM
We propose an analysis of the structural properties of genes, using a discrimination method based on HMMs Introduction • Intensive sequencing • Genes represent only 3% of the human genome Markovian models are widely used for the identification of genes
Drawback: • The distribution of the sojourn time in a given state is geometric • The empirical distribution of the length of the exons is not geometric ! Introduction Hidden Markov model Advantages: Each state represents a different type of region in the sequence The complexity of the algorithm is linear with respect to the length of the sequence
HMM for the genomic structure of DNA sequences Structure of the HMM model t1 No CDS CDS 1-t1 1-t2 t2 Bases probabilities A pA C pC G pG T pT Bases probabilities A qA C qC G qG T qT CDS: coding sequence
HMM for the genomic structure of DNA sequences Several biological properties of DNA sequences were taken into account • Model of order 5
St-6 St-5 St-4 St-3 St-2 St-1 St Xt-6 Xt-5 Xt-4 Xt-3 Xt-2 Xt-1 Xt HMM for the genomic structure of DNA sequences Several biological properties of DNA sequences were taken into account • Model of order 5
St-6 St-5 St-4 St-3 St-2 St-1 St Xt-6 Xt-5 Xt-4 Xt-3 Xt-2 Xt-1 Xt HMM for the genomic structure of DNA sequences Several biological properties of DNA sequences were taken into account • Model of order 5
St-6 St-5 St-4 St-3 St-2 St-1 St Xt-6 Xt-5 Xt-4 Xt-3 Xt-2 Xt-1 Xt HMM for the genomic structure of DNA sequences Several biological properties of DNA sequences were taken into account • Model of order 5
St-6 St-5 St-4 St-3 St-2 St-1 St Xt-6 Xt-5 Xt-4 Xt-3 Xt-2 Xt-1 Xt HMM for the genomic structure of DNA sequences Several biological properties of DNA sequences were taken into account • Model of order 5
St-6 St-5 St-4 St-3 St-2 St-1 St Xt-6 Xt-5 Xt-4 Xt-3 Xt-2 Xt-1 Xt HMM for the genomic structure of DNA sequences Several biological properties of DNA sequences were taken into account • Model of order 5
HMM for the genomic structure of DNA sequences Several biological properties of DNA sequences were taken into account • Length distributions of exons and introns according to their position in genes: Internal intron Initial intron Initial exon Terminal intron Internal exon Intergenic region Terminal exon Single exon
Internal intron Initial intron Initial exon Terminal intron Internal exon Intergenic region Terminal exon Single exon HMM for the genomic structure of DNA sequences Several biological properties of DNA sequences were taken into account • Length distributions of exons and introns according to their position in genes:
Internal intron Initial intron Initial exon Terminal intron Internal exon Intergenic region Terminal exon Single exon HMM for the genomic structure of DNA sequences Several biological properties of DNA sequences were taken into account • Length distributions of exons and introns according to their position in genes:
Internal intron Initial intron Initial exon Terminal intron Internal exon Intergenic region Terminal exon Single exon HMM for the genomic structure of DNA sequences Several biological properties of DNA sequences were taken into account • Length distributions of exons and introns according to their position in genes:
HMM for the genomic structure of DNA sequences Several biological properties of DNA sequences were taken into account • Length distributions of exons and introns according to their position in genes: Internal intron Initial intron Initial exon Terminal intron Internal exon Intergenic region Terminal exon Single exon • Direct and reverse strands
p p p p 1-p 1-p Exon 1-p frame 0 frame 1 frame 2 HMM for the genomic structure of DNA sequences Several biological properties of DNA sequences were taken into account • Codons: 1-p
HMM for the genomic structure of DNA sequences Sojourn time in a HMM state must follows a geometric law p Length of a hidden state T: sojourn time in a given state T follows a geometric law 1-p CDS Times of stay in state CDSProbability 1 1-p 2 p (1-p) 3 p2 (1-p) … n pn-1 (1-p) Geometric law
Probability Length of the internal exons Method: estimation of the length of a region HMM for the genomic structure of DNA sequences Méthode • Geometric laws does not fit the empirical distribution of the length of exons
Probability • We suggest to: Length of the internal exons State State 1 State 2 Method: estimation of the length of a region HMM for the genomic structure of DNA sequences Méthode • Geometric laws does not fit the empirical distribution of the length of exons
Probabilityt Probability • Good fit with sums of • 5 geometric random variables Length of the internal exons • We suggest to: Length of the internal exons State State 1 State 2 Method: estimation of the length of a region HMM for the genomic structure of DNA sequences Méthode • Geometric laws does not fit the empirical distribution of the length of exons
HMM for the genomic structure of DNA sequences Method: estimation of the length of a region • Data: Human genome * extracted from HOVERGEN • Different length distributions: * Sum of geometric laws of equal parameter with =1..7 * Sum of 2 or 3 geometric laws of different parameters • For each region: * We choose parameters that minimize the Kolmogorov-Smirnov distance * We do not use the maximum likelihood method
HMM for the genomic structure of DNA sequences Results: Estimation of the length of a region Maximum likelihood estimation Kolmogorov-Smirnov estimation Probability Length of the initial exon
HMM for the genomic structure of DNA sequences Probabilityt Length of the internal exons The model fits very well the empirical distribution Results: Estimation of the length distribution of internal exons Sum of 5 geometric laws p=1/26
HMM for the genomic structure of DNA sequences Many small genes with single exons are pseudogenes Results: Estimation of the length distribution of intronless genes Sum of 2 geometric laws p=1/440
Contents • Introduction • HMM for the genomic structure of DNA sequences • Discrimination method based on HMM • Conclusion • Direction of research
Discrimination method based on HMM Method: A model for initial, internal, terminal exons • Emission probabilities for each state are estimated by the frequencies of words with 6 letters (model of order 5)
Discrimination method based on HMM • Discrimination method to test the homogeneity between regions: D = { log P(S/ HMM1) - log P(S/ HMM2) } / |S| (Eq. 1) S is the test sequence of length |S| HMM1: Initial Exon HMM2: Internal exon Sequence is characterized by the HMM with the best likelihood likelihood Sequence Method: A model for initial, internal, terminal exons • Emission probabilities for each state are estimated by the frequencies of words with 6 letters (model of order 5)
Discrimination method based on HMM Decision N1 initial exons N-N1 internal exons N-N1 N1 Each model is characterized by the frequency of sequence recognition Quality of the decision:We want to know if models are well adapted to their regions (HMMs are compared pair wise) {Initial exon sequences} N
Discrimination method based on HMM Internal exon ≈ Terminal exon Initial exon ≠ Internal exon Initial exon ≠ Terminal exon • Results: Comparison of different HMMs on different test sequences
Discrimination method based on HMM Internal exon ≈ Terminal exon Initial exon ≠ Internal exon Initial exon ≠ Terminal exon • Results: Comparison of different HMMs on different test sequences
Discrimination method based on HMM Internal exon ≈ Terminal exon Initial exon ≠ Internal exon Initial exon ≠ Terminal exon • Results: Comparison of different HMMs on different test sequences
Discrimination method based on HMM Internal exon ≈ Terminal exon Initial exon ≠ Internal exon Initial exon ≠ Terminal exon • Results: Comparison of different HMMs on different test sequences
Discrimination method based on HMM HMM Start HMM End Initial exon HMM Initial exon HMM • Results:Break in the homogeneity of the first coding exon To determine the break point in first exon sequences, we consider different HMMs: k • The HMM representing the initial exon was split into 2 HMMs around the kth base • A “Start” HMM is trained on the first k bases • An “End” HMM is trained on the remaining bases
Discrimination method based on HMM • Results:Break in the homogeneity of the first coding exon M_EI80 Other models
Discrimination method based on HMM • Results:Break in the homogeneity of the first coding exon M_EI80 Other models
Discrimination method based on HMM • Results:Break in the homogeneity of the first coding exon M_EI80 Other models
Discrimination method based on HMM • Results:Break in the homogeneity of the first coding exon M_EI80 Other models
Discrimination method based on HMM 25% 75% • Results:Initial exons with peptide signal (SignalP) HMM Start HMM End
Discrimination method based on HMM without peptide signal 25% 10% 90% 75% HMM Start characterizes well the peptide signal • Result:Initial exons with peptide signal (SignalP) HMM Start HMM End
Conclusion Modelling of the exons length distribution: • Sums of geometric laws fit well the distribution of exons lengths • The model has relatively few parameters • Sum of 5 geometric laws of the same parameter (internal exons) • Sum of 3 geometric laws of different parameters (terminal exons)
Conclusion • Break of homogeneity of initial exonaround 80th base Peptide signal Modelling of the exons length distribution: • Sums of geometric laws fit well the distribution of exons lengths • The model has relatively few parameters • Sum of 5 geometric laws of the same parameter (internal exons) • Sum of 3 geometric laws of different parameters (terminal exons) • Discrimination method based on HMM: • Bad annotation in database of the intronless genes • Homogeneity between internal and terminal exons
Contents • Introduction • HMM for the genomic structure of DNA sequences • Discrimination method based on HMM • Conclusion • Direction of research
Direction of research Markovian models for the analysis of the organization of genomes Chromosome 9 Content of GC Versteeg 2003
Direction of research Markovian models for the analysis of the organization of genomes Chromosome 9 Content of GC Genes density Versteeg 2003
Direction of research Markovian models for the analysis of the organization of genomes Chromosome 9 Content of GC Genes density Size of introns Versteeg 2003
Direction of research Markovian models for the analysis of the organization of genomes Chromosome 9 Content of GC Genes density Size of introns Repeated elements Versteeg 2003
Direction of research Markovian models for the analysis of the organization of genomes Chromosome 9 Content of GC Genes density Size of introns Repeated elements Genes expression Versteeg 2003
Direction of research Structure superposition in genomes A chromosome Isochore level Gene level Exon-intron level Codon level intron exon acc gcc agt tac ccc aga
Direction of research Scan the genome • Build 3 HMMs adapted to the organization structure of each of the 3 isochores classes H, L, M H= [72%, 100%] M= ]56%, 72%[ L= [0%, 56%] • Human chromosomes are divided into overlapping 100 kb segments. Two successive segments overlap by half of their length. • Bayesian approach: for each segment and for each model (H, L and M), we compute the probability P[Model | Segment] Segment is characterized by the model with the best probability