Download
1 / 1
10 likes | 107 Views
Suppl Figure2. B. A. Recurrence-free survival. Recurrence-free survival. %. %. 100. 100. CRP<1 (n=130). CRP<2 (n=147). 80. 80. CRP≥2 (n=11). CRP≥1 (n=28). 60. 60. p=0.10. p=0.56. 40. 40. 20. 20. post-transplantation ( year ). post-transplantation ( year ). 0. 0. 0. 1.

E N D
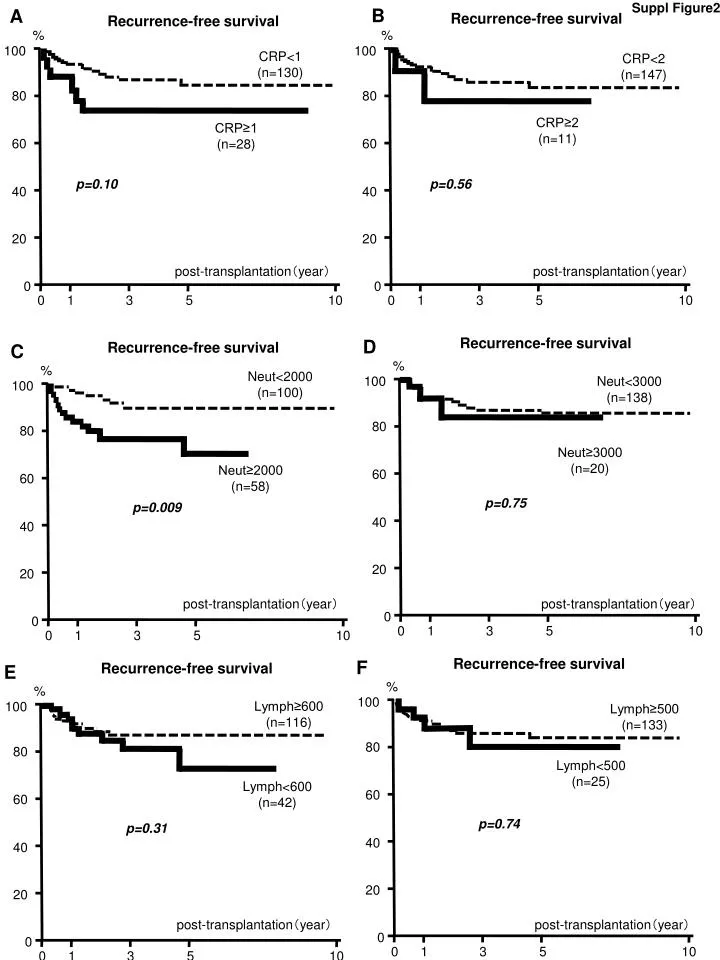
Suppl Figure2 B A Recurrence-free survival Recurrence-free survival % % 100 100 CRP<1 (n=130) CRP<2 (n=147) 80 80 CRP≥2 (n=11) CRP≥1 (n=28) 60 60 p=0.10 p=0.56 40 40 20 20 post-transplantation(year) post-transplantation(year) 0 0 0 1 3 5 10 0 1 3 5 10 Recurrence-free survival D Recurrence-free survival C % % Neut<2000 (n=100) 100 Neut<3000 (n=138) 100 80 80 Neut≥3000 (n=20) Neut≥2000 (n=58) 60 60 p=0.75 p=0.009 40 40 20 20 post-transplantation(year) post-transplantation(year) 0 0 0 1 3 5 10 0 1 3 5 10 Recurrence-free survival F Recurrence-free survival E % % 100 Lymph≥600 (n=116) 100 Lymph≥500 (n=133) 80 80 Lymph<500(n=25) Lymph<600(n=42) 60 60 p=0.74 p=0.31 40 40 20 20 post-transplantation(year) post-transplantation(year) 0 0 0 1 3 5 10 0 1 3 5 10