Download
1 / 28
280 likes | 388 Views
Occupational safety: Building of a cost effective quantified risk model. Ing. J.I.H. Oh Directorate Safety & Health Ministry of Social Affairs and Employment Joh@minszw.nl 26 May 2005. Statistics Netherlands:. About 7.000.000 workers in 500.000 companies;

E N D
Occupational safety: Building of a cost effective quantified risk model Ing. J.I.H. Oh Directorate Safety & Health Ministry of Social Affairs and Employment Joh@minszw.nl 26 May 2005
Statistics Netherlands: • About 7.000.000 workers in 500.000 companies; • 85.000 occupational incidents (2004): about 40 incidents every working hour • 83 persons died (2004): 1-2 workers die of an accident every working week. • Bulk of these incidents in 51 hazardous branches with 3.000.000 workers Main causes: • Falling from height • Contact with machines • Hit by vehicles • Falling objects
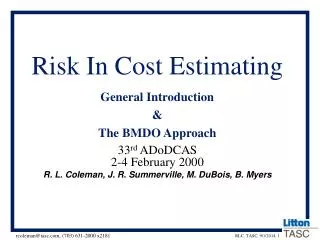
Development in Occupational Safety Policy S A F E T Y Since 2000 Culture Since 1980 Organisation Up until 1980 based on Technology
SZW beleidskader Policy actions 2003-2007: • Interventions with respect to safety culture and –awareness in companies; Aim: 10-15 % less incidents in 20 selected projects Development of a financial model for occupational incidents • Risk based policy on basis of a quantitative risk model for workers • High political commitment and thus the resources
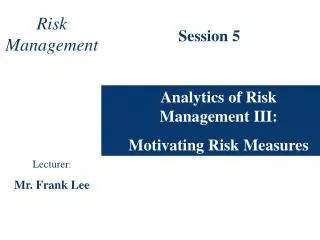
Understanding accidents causes and effects Development of risk management system (understanding employee risk) Understanding the efficiency of measures Culture interventions Implementing safety improvement projects Raising safety awareness (individual employees) Improving safety culture (organisation level) Implementing good practices Reducing the number of industrial accidents by 10% - 15% in each of the 20 safety improvements projects. Structure of the Program
Why risk based policy and a risk model? • Priority tool for regulator and company: deterministic approach will be more transparant • Calculation of probability on an incident of a specific worker, the effect of measures taken and the cost effectiveness of those measures • Start of an integral risk policy: connects with the land use planning and transport risk models • The model is developped by an international projectgroup
Program Improving Occupational Safety Who are involved? National International Companies Improvement projects Soc. Partners Steering committee EU Commission Risk Model science Risk model UK, DK Model, data
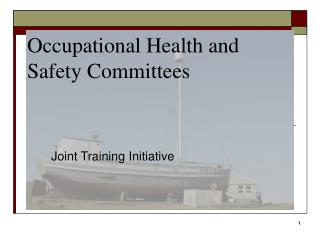
causes Incident damage Event tree Fault tree Everything that leads to the incident Everything that is the result of the incident bow-tie
Building the model • Incidents are converted into scenario’s and bow ties • Barriers and management influences are modelled • Quantification of the bow tie on the basis of incident data and expert opinion • Development of a cost effective riskreduction strategy • Building of a six step QRA
Horrible Stories convertedInto storybuild scenario’s • 12500 detailed accident reports of Dutch Labour Inspectorate • 1998 – Feb 2004 • Reportable under the Dutch law: • Death (within 1 year), permanent injury, in-patient treatment in hospital within 24 hours. • Around 10,000 accidents modelled in around 50 Storybuilds • Some storybuilds contain more than 1000 accidents • e.g. fall from ladder has 1057 scenarios with 1061 victims • 5 person years of effort
Totaal lijst van bowties Occupational Risk Model
Summary • Storybuilds capture ALL known causes of Dutch reportable accidents • The models can assist in understanding how "horrible stories" occur • The models can be used for identifying the dominant conditions which give rise to accidents • Policy makers, inspectors and company safety personnel can use these structures in e.g. accident investigation
1.1.2. Scaffold accidents • Every year there are around 70 falls from scaffold accidents Deaths 1 Permanent injuries 5 Recoverable injuries 35
Deaths 1 Permanent injuries 40 Recoverable injuries 10 • A first pass assessment suggests that every year there are around 500 machine accidents in Nederland involving contact with moving parts
MOVING MACHINES: INJURIES • Around 50% of injuries involve traumatic amputations of body parts • Practically all of these are lost fingers or lost hand • 50% of known cases of lost time were more than 1 month of which 10% of all known cases were more than 6 months • When deaths occurred head, shoulders and whole body injuries were indicated
CONTACT MOVING PARTS OF MACHINE (cont.) • In 30% of accidents management failed to provide adequate equipment to prevent the accidents • In 30% of accidents there were procedural failures in providing prevention measures • 20% of failures were safety motivation failures in operating machines safely and not entering the danger zone. • 30% of cases had no machine guard provided
Ladder accidents • Every year there are on average 3 deaths from falls from a ladder, 30 permanent injuries and 90 recoverable serious injuries Deaths 1 Permanent injuries 10 Recoverable injuries 30
Mobile ladder accidents: 3 mutually exclusive reasons that directly lead to falls • Mostly due to setting it up incorrectly • 67% LADDER STABILITY fails: • The rest due to • an unstable surface • being hit by something • poor position of the person on the ladder • 29% USER ABILITY fails • mostly due to loss of control over body movement such as due to the force of using a tool or a misstep • 4% LADDER STRENGTH fails • Due to substandard condition or type of ladder
MISMATCH • In almost 50% of the ladder accidents, mismatch between the activity being undertaken and the tool or method used played a part. Arbobesluit art. 7.3 lid1&3 en Art.3.16 lid1.
MOTIVATION • In 50% of ladder accidents, lack of motivation for safety played a role, so lack of.. • Alertness, care & attention, • Concern for safety of self & others, • Risk avoidance, • Willingness to learn & improve
CONFLICTS • Conflicts with ‘profit’ goals played a role in 20% of ladder accidents
CONSEQUENCES Drowning Broken legs Squashed fingers Cut hands Hook in eye Contaminated cut The challenge of smart cod INHERENT HAZARDS Slippery surfaces Moving equipment Boat movements Working with hooks and knives Factors affecting Conditional Probabilities Being in rough sea Attention Personal protection Overloading Rhythm of work Hurrying (time pressures) Tidiness of boats Radio Type of fish Seaworthiness of boat We want data on…
State of Affairs of the quantified risk model • An incident model was adopted • 10.000 investigated incidents are analysed and modelled in the so called tool “storybuilder” • Storybuilder is a powerfull tool for incident analysis • The stories were converted and quantified with the tool “bow tie builder” • A first draft of the quantified model is ready • A financial model for cost benefits of incident prevention has been build • The model will be filled with storybuilder data and data from workers surveys • In late 2006 the testing and validation exercise will start