Download
1 / 12
120 likes | 222 Views
California Beaches are Economic Drivers Billions $/year thretened by Innundation & Erosion Bob Guza & Bill O’Reilly, SIO. California Beaches & Harbors are Economic Drivers. Coastal infrastructure threatened NOW. Hwy 101, Nov ‘01. Leucadia, Feb ’02.

E N D
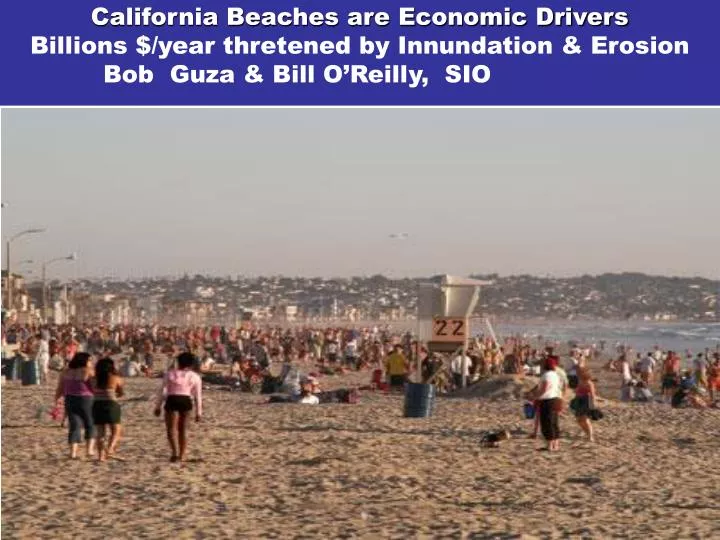
California Beaches are Economic Drivers Billions $/year thretened by Innundation & Erosion Bob Guza & Bill O’Reilly, SIO California Beaches & Harbors are Economic Drivers
Coastal infrastructure threatened NOW Hwy 101, Nov ‘01 Leucadia, Feb ’02 Pndltn Hovrcrft Ramp Erosion LA-SDiego AMTRAK Rails
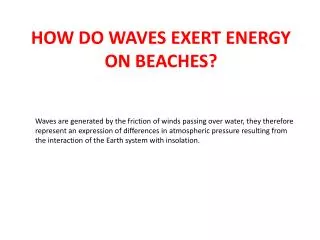
Superposition Erosion/innudation when “sea level” is high West Coast • Tides(1-3 m): predictable • El Niño sealevel rise (<0.3m) • Storms surge < 0.5 m • << East & Gulf Coast • STORM Wave uprush/setup (1-5 m)
Coastal Inundation Risk Assessment w. Big Pacific Ocean Waves (CA,OR,WA,AK, HA) Typical Shoreline Elevation PhysicalProcess 2010 2100 Tides ~2 m Storm Waves ~4 m O - ?1-2? (m) Steric Sea Level Sea Level Anomalies ± 0.3m Storm Surge + 0.5m
Rivers and Cliffs Provide(d) Beach Sand : Past tense California Coastal Records Project (07781) 2004 D. L. Inman Photo
Sandy in summer Rocky in winter Thin sand veneer over wave-cut terrace. Reduced sand supply = balance tilted to erosion
Mission Beach 2000 Mission Beach 2100 ≈ 1 meter Flooding + Beach Erosion More often & more severe Future Sea Level Rise cm) From IPCC 2001 report on climate change, based on SRES scenarios.
Southern California Sand levelobservations L.A. S.Barbara L.A. Torrey Pines San Diego Colors show wave height
Sand level surveys with GPS equipped vehicles (land, air and sea).
Monitoring REQUIRED to track effects of climate (and other) changes 30 summer accretion Beach width change (m) winter 09/10 winter erosion -30 2001 Date 2010 HUGE seasonal Beach width variation. 10 yrs is too short to show trend. Narrowest beaches : ElNino winter 09/10.
Wave Erosion & Innundation depends on local factors. • Models need calibration • NEED ongoing observations & modeling of S. Calif • Extreme storm erosion @ vulnerable locations • Beach nourishments (e.g. erosion mitigations) • Hwy/coastal/bayside (SD & Oakland airports) flooding. • Coastal flooding in 09/10 El Nino winter NOT monitored(missed opportunity) • On this path, details (where the Devil lives) of SHORELINE physical processes will remain mysterious. • Design of BIG shoreline engineering projects will be impacted.
Combined Effect of Sea Level Rise, Ocean Warming Events, Tides and Waves Elevation Maximum Potential Inundation Elevation 6m + Extreme Storm Wave Runup 3.5 m Episodic Risk Factors + PDO + ENSO 2m + Extreme High Tide Sea Level Today Ice Loss? 0m Long-Term Risk Factors California in 2100+ California Today