Download
1 / 34
350 likes | 504 Views
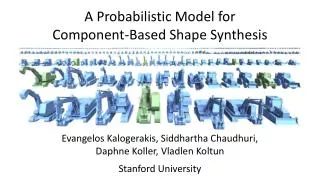
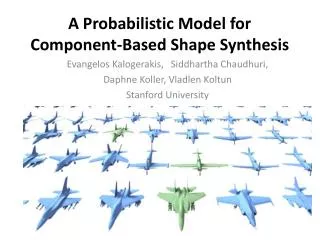
A Probabilistic Model for Component-Based Shape Synthesis. Evangelos Kalogerakis , Siddhartha Chaudhuri , Daphne Koller , Vladlen Koltun Stanford University. Bayesian networks. Directed acyclic graph (DAG) Nodes – random variables Edges – direct influence (“causation”)

E N D
A Probabilistic Model for Component-Based Shape Synthesis EvangelosKalogerakis, Siddhartha Chaudhuri, Daphne Koller, VladlenKoltun Stanford University
Bayesian networks • Directed acyclic graph (DAG) • Nodes – random variables • Edges – direct influence (“causation”) • Xi?Xancestors | Xparents • e.g., C ? {R,B,E} | A • Simplifies chain rule by using conditional independencies Earthquake Burglary Radio Alarm Call Pearl, 1988 SP2-2
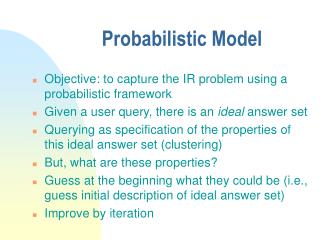
Goal • A tool that automatically synthesizes a variety of new, distinct shapes from a given domain.
Various geometric, stylistic and functional relationships influence the selection and placement of individual components to ensure that the final shape forms a coherent whole. Sailing ships vary in: - Size - Type of hull, keel and mast - The number and configuration of masts.
Probabilistic Reasoning for Assembly-Based 3D Modeling Siddhartha Chaudhuri, EvangelosKalogerakis, Leonidas Guibas, and VladlenKoltun ACM Transactions on Graphics 30(4) (Proc. SIGGRAPH), 2011
The probabilistic model is flat!!!! It describes the relationship among components, but it does NOT tells us how these components form the whole structure.
Offline Learning Online shape synthesis
The model structure R - shape style S = {Sl} - component style per category l N = {Nl} - number of components from category l. C = {Cl} - continuous geometric feature vector for components from category l. (curvature histograms, shape diameter histograms, scale parameters, spin images, PCA-based descriptors, and lightfield descriptors) D = {Dl} - discrete geometric feature vector for components from category l. (encode adjacency information.)
For 4-legged table: Ntop=1 or 2; Nleg=4; Stop=rectangular tabletops Sleg=narrow column-like legs For 1-legged table Ntop=1 Nleg=1 Stop=roughly circular tabletops Sleg=split legs
Learning • The input: • Aset of K compatibly segmented shapes. • For each component, we compute its geometric attributes. • The training data is thus a set of feature vectors: • O = {O1,O2, . . . ,Ok}, where Ok= {Nk,Dk,Ck}. • The goal • learn the structure of the model (domain sizes of latent variables and lateral edges between observed variables) and the parameters of all CPDs in the model.
The desired structure G is the one that has highest probability given input data O [Koller and Friedman 2009]. By Bayes’ rule, this probability can be expressed as Max P(G|O) -- > Max P (O | G)
Assume prior distributions over the parameters Θ of the model. parameter priors summing over all possible assignments to the latent variables R and S: the number of integrals is exponentially large !!!
To make the learning procedure computationally tractable, they use an effective approximation of the marginal likelihood known as the Cheeseman-Stutz score [Cheeseman and Stutz 1996]: the parameters estimated for a given G a fictitious dataset that comprises the training data O and approximate statistics for the values of the latent variables. The score defines a metric to measure how good a model is. The goal is to search a G maximize the score!
What does the G mean? The number of table styles (R) Whether a category of components belongs to a specific style? What is the number? (S)
Greedy Structure search • Initially, set the domain size of 1 for R (a single shape style). • for each category l, • Set the component style as 1, compute the score, then 2, 3, …, stop when the score decreases. The local maximal value is the style number of l. Move the next category. • After the search iterates over all variables in S, increase the domain size of R and repeat the procedure. • terminates when the score reaches a local maximum that does not improve over 10 subsequent iterations;
Domain size of R =1 • All tables belong to the same style. • For leg: • Compute the score for case 1: all legs are of the same style; • Compute the score for case 2: narrow column-like legs and split legs. • Compute the score for case 3: three styles of legs. Score decreases so stop. • For table-top: • …
CPT of R CPT of Stop (R=1) CPT of Stop (R=2) 2 2 2 1 1 1 5/12 7/12 1.0 0.0 0.0 1.0 CPT of Sleg (R=1) CPT of Sleg (R=2) 2 2 1 1 … 1.0 0.0 0.0 1.0
Shape Synthesis • Step 1: Synthesizing a set of components 1-legged or 4-legged column-like or split Rect or circular? Pruning: Branches that contain assignments that have extremely low probability density
Shape Synthesis • Step 1: Synthesizing a set of components • Step 2: Optimizing component placement “slots” specify where this component can be attached to other components.
Shape Synthesis • Step 1: Synthesizing a set of components • Step 2: Optimizing component placement penalizes discrepancies of position and relative sizebetween each pair of adjacent slots
Shape Synthesis • Step 1: Synthesizing a set of components • Step 2: Optimizing component placement
Application: Shape database amplification • synthesize all instantiations of the model that have non-negligible probability • identify and reject instantiations that are very similar to shapes in the input dataset or to previous instantiations. (by measuring the feature vectors of corresponding components)
Application: Constrained shape synthesis • Give partial assignments to constrained random variables assume values only from the range corresponding to the specified constraints. 4-leg split
Results • Learning took about 0.5 hours for construction vehicles, 3 hours for creatures, 8 hours for chairs, 20 hours for planes, and 70 hours for ships. • For shape synthesis, enumerating all possible instantiations of a learned model takes less than an hour in all cases, and final assembly of each shape takes a few seconds.
Can it generate models like below? or or The probability should be very low.
Inspiration- Variability vs plausibility • To maintain plausibility: should be similar to the existing ones; • To increase variability: should be as different as possible from the existing ones. • This work is good for maintaining plausibility but the variability seems low. • How to pursue large variability while maintaining plausibility? or
Topic? Generating shape variation by variability transfer • learn the varying model in the dataset rather than the shape model. • Use the varying model to synthesize new shape in another dataset.
Topic? function-preservedshape synthesize • The function of a component is not taken into account in the current model… • By considering function, we can create variations with high dissimilarity on geometric looking while preserve the function.