Download
1 / 16
160 likes | 305 Views
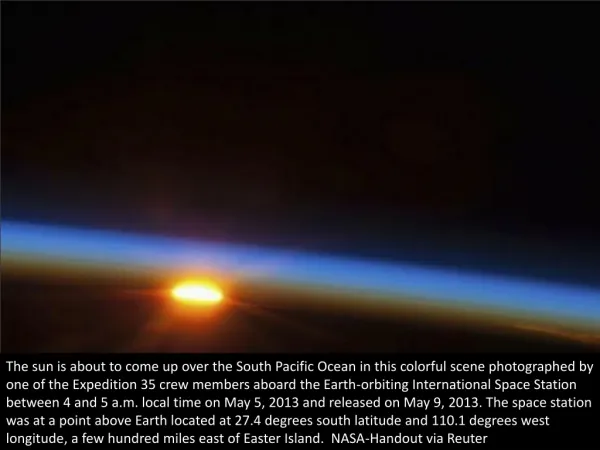
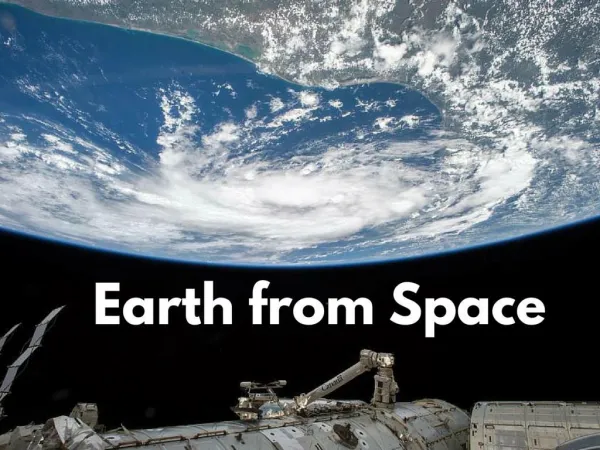
Sulphur From Space. Retrievals from the MIPAS Satellite Instrument. Alastair Burgess Anu Dudhia, Don Grainger. AOPP, University of Oxford. aburgess@atm.ox.ac.uk. M ichelson I nterferometer for P assive A tmospheric S ounding

E N D
Sulphur From Space Retrievals from the MIPAS Satellite Instrument Alastair Burgess Anu Dudhia, Don Grainger AOPP, University of Oxford aburgess@atm.ox.ac.uk
Michelson Interferometer for Passive Atmospheric Sounding 685 - 2410 wavenumber (4 -16 micron) range at 0.025 cm-1 resolution. Fourier Transform Limb Thermal Emission Infrared Spectrometer Launched 1st March 2002 as a part of Envisat Polar orbit of 100 minutes at 800 km What is MIPAS?
Assessing Feasibility (e.g. OCS) • Simulate expected radiance at satellite. The RFM. • Model target species radiance contribution • Check noise level • Feasibility assessment based on ‘microwindow’ selection approach • Allows tracking and minimization of both systematic and random error sources • Do we gain on the climatological uncertainty?
Microwindow Error Analysis (e.g. OCS) • Random error dominated • Coaddition • Radiance - non-linear • Retrieval - apriori bias • Residual - compromise? • Systematics contribute <5% • Most sensitive to • Temperature retrieval • Strong radiance gradient • Ozone (lowermost level)
Carbonyl Sulphide • Sources • Biomass burning, Industry, Forests, Oceans, Soils…. • Sinks • Oceans, Forests, Soils… Depending on season. OH and O radicals. • Trends and Distribution • Long lifetime (few years) in troposphere… well mixed around 500 pptv • ranges 450 - 550 pptv, possible inter-hemispheric ratio and long-term trend. • Susceptible to UV photolysis… falls to 10 pptv by 30 km.
OCS Retrieval Chin&Davis, 1995 MIPAS Extrapolated • Stratospheric values shown • Same scales… good agreement with literature profile. • Many many more measurements above 22 km • Shaded region is standard deviation • Combination of retrieval error and global variability • Individual profiles show 15-45% random error below 20 km.
OCS - Zonal Mean - August 2003 • Cloud • Data gaps at low levels • Highs in south polar night • Low Temperature coupled with D-band?
OCS - Global Maps - August 2003 • 6 & 9km levels well mixed. • High values over Indonesia • Intertropical convergence zone? • Biomass burning? • Cloud bias :(? • Some ‘highs’ have a low measurement density (tens) so biased by an outlier?
SO2 - Zonal Mean - August 2003 • North : South Tropospheric asymmetry • Anthropogenic emissions • Problem with the South Polar region – unfeasible highs. • Only 2-3 (of 9 levels) degrees of freedom per profile • Uppermost levels have much reduced confidence
SO2 - Global Map - August 2003 • Few Profiles low down • (due to high numbers cloud invalidated) • Some similarities to OCS. • Biomass burning? • Anthropogenic sources visible?
Sulphur Hexafluoride • Sources • Electric & Aluminium industry • Sinks • Photololysis and high energy electron capture in the Mesosphere • Trends and Distribution • Very Long lifetime in troposphere and stratosphere (1000s years) • <5 pptv. Tropospheric variability purely from dynamics w.r.t source locations. • Inter-hemispheric ratio observed (Only N.H. sources). Annual trend ~7% Inert tracer Allows study of dynamics Especially, age of air … which allows air flux calculation Figure from A. Plumb, J Met Soc Jap 2002
SF6 - Monthly Variation • Monthly variation • Mesospheric Descent? (Or temperature bias!?) • Random error rises above 50% at 25km… • Magnitude of interhemispheric variation • Literature: ~1.5 years = 7-10% in SF6 VMR.
Stratospheric Aerosol Layer – Putting it all together Net flux 0.03 Tg/yr based on VMR 550pptv at TP Net flux 0.03 Tg/yr based on VMR 40pptv at TP Scientific Assessment of Ozone Depletion (2002) states Source of stratospheric aerosols: 20 – 50 % OCS 80 – 50 % SO2 cites further modelling studies to support this Weisenstein et al. (1997), Kjellstrom (1998), Pitari et al. (2002) From Scientific Assessment of Ozone Depletion (2002) Combining MIPAS OCS and SO2 measurements with aerosol data limits SSA sources: 30% - 50% SO2
OCS, SO2 and SF6 have been successfully retrieved Global, height resolved fields. Trade-off time / space resolution to improve random errors These species are all a ‘bonus’ to the baseline mission expectations Far from perfect, however. Tropics short of low altitude measurements - cloud. Large differences between some adjacent points - real? Higher than expected values consistently retrieved in some areas - biases? Further work In progress Equinox and Solstice months where MIPAS available Compare the annual cycle with model fields & other external validation Climatologies - based on global measurement by the same instrument Sulphur budgets and aerosol pathways Have already calculated reservoir masses and approximate fluxes The latest developments:http://www.atm.ox.ac.uk/groups/mipas/ Conclusions