Download
1 / 12
120 likes | 315 Views
Data Mining and the OptIPuter. Padhraic Smyth University of California, Irvine. Data Mining of Spatio-Temporal Scientific Data. Modern scientific data analysis increasingly data-driven data often consist of massive spatio-temporal streams Research focus

E N D
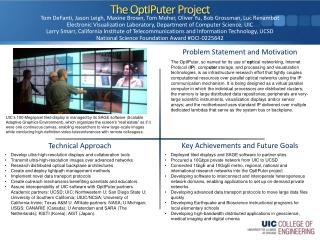
Data Mining and the OptIPuter Padhraic Smyth University of California, Irvine
Data Mining of Spatio-Temporal Scientific Data • Modern scientific data analysis • increasingly data-driven • data often consist of massive spatio-temporal streams • Research focus • characterizing spatio-temporal structure in data • statistical models for object shapes, trajectories, patterns... • data mining from scientific data streams (NSF, Optiputer) • recognition of waveforms in time-series archives (JPL,NASA) • inference of dynamic gene-regulation networks from data (NIH) • Markov models for spatio-temporal weather patterns (DOE) • clustering and modeling of storm trajectories (LLNL)
Image-voxel Data (“slices” of olfactory bulb in rats) Automatic segmentation of cellular structures of interest (glomelular layer) • Thematic maps • Data mining • Scientific discovery
Image-voxel Data (Remote sensing AVIRIS spectral data) Focus of attention on wavelengths of interest • Thematic maps • Data mining • Scientific discovery
What’s wrong with this information flow? • “One-way” • Flow of information is from data to scientist • Real scientific investigation is “two-way” • Scientist interacts, explores, queries the data • Most current data mining/analysis tools are relatively poor at handling interaction • Algorithms are “black-box”, do not allow scientists to be “in the loop” • Algorithms have no representation of the scientist’s prior knowledge or goals (no user models) • OptIPuter project • “next generation” data mining tools for effective exploration of massive 2d/3d data sets
OptIPuter focus in Data Mining • Data • 2d (or multi-d) spatio-temporal image/voxel data • Goals • Allow scientists to explore these massive data sets in an efficient and flexible manner leveraging the OptIPuter architecture • Produce interactive software tools that allow scientists to explore massive data in an interactive manner: • automated segmentation, thematic maps, focus of interest • Technical Challenges • Scaling statistical algorithms to massive data streams • Providing mechanisms for effective scientific interaction • Developing algorithms for automated “focus-of-attention”
Analysis of Extra-Tropical Cyclones [with Scott Gaffney (UCI), Andy Robertson (IRI/Columbia), Michael Ghil (UCLA)] • Extra-tropical cyclone = mid-latitude storm • Practical Importance • Highly damaging weather over Europe • Important water-source in United States • Scientific Importance • Influence of climate on cyclone frequency, strength, etc. • Impact of cyclones on local weather patterns
Sea-Level Pressure Data • Mean sea-level pressure (SLP) on a 2.5° by 2.5° grid • Four times a day, every 6 hours, over 20 years Blue indicates low pressure
Clustering Methodology • Mixtures of curves • model as mixtures of noisy linear/quadratic curves • note: true paths are not linear • use the model as a first-order approximation for clustering • Advantages • allows for variable-length trajectories • allows coupling of other “features” (e.g., intensity) • provides a quantitative (e.g., predictive) model • [contrast with k-means for example]
Applications • Visualization and Exploration • improved understanding of cyclone dynamics • Change Detection • can quantitatively compare cyclone statistics over different era’s or from different models • Linking cyclones with climate and weather • correlation of clusters with NAO index • correlation with windspeeds in Northern Europe