Download
1 / 14
140 likes | 146 Views
P. a. a - bR. 0. R t. a/b. R. Figure 15.1 The non-renewable resource demand function for the two-period model. P. K. U(R) = shaded area. Ke -aR. 0. R. Quantity of resource extracted, R.

E N D
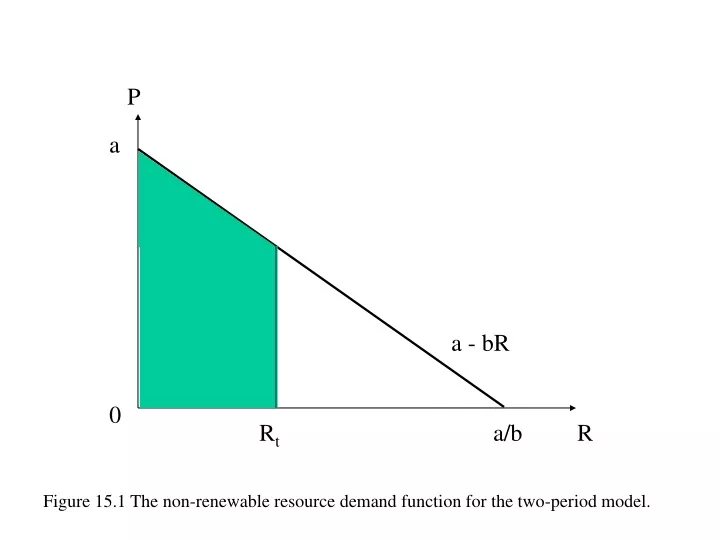
P a a - bR 0 Rt a/b R Figure 15.1 The non-renewable resource demand function for the two-period model.
P K U(R) = shaded area Ke-aR 0 R Quantity of resource extracted, R Figure 15.2 A resource demand curve, and the total utility from consuming a particular quantity of the resource.
Figure 15.3 Net price Pt PT =K Demand P0 Pt T 45° R0 R Time t Rt Area = = total resource stock T Time t
Figure 15.4 Net price Pt Perfect competition PT = PTM = K Demand Monopoly P0M P0 T TM R0M R R0 Time t T Area = TM 45° Time t
P A C B K P0 Time T Figure 15.5 The effect of an increase in the interest rate on the optimal price of the non-renewable resource.
Figure 15.6 Net price Pt K Demand P0 P0/ T/ T R0 R R0/ Time t T/ T 45° Time t
Figure 15.7 Net price Pt K Demand P0 P0/ T T/ R0 R R0/ Time t T T/ 45° Time t
Figure 15.8 Net price path with no change in stocks Pt Net price path with frequent new discoveries t
Figure 15.9 Net price Pt K P0/ D/ P0 D T/ T R0 R R0/ Time t T/ T 45° Time t
Figure 15.10 (a) Net price Pt K Backstop price fall PB P0 P0/ D R* T/ T R0 R R0/ Time t T/ T 45° Time t
Figure 15.10 (b) Net price Pt K Backstop price fall PB P0 P0/ D R* T/ T R0 R R0/ Time t T/ T 45° Time t
Resource price K Original net price New gross price Original gross price New net price cL cH T Figure 15.11(a) Time
Resource price Original gross price K Original net price New gross price New net price T/ T Figure 15.11(b) Time
Figure 15.12 Net price Pt Original gross price path K New gross price path P0/ P0 T T/ R0 R R0/ Time t T T/ 45° Time t