Download

1 / 14
140 likes | 234 Views
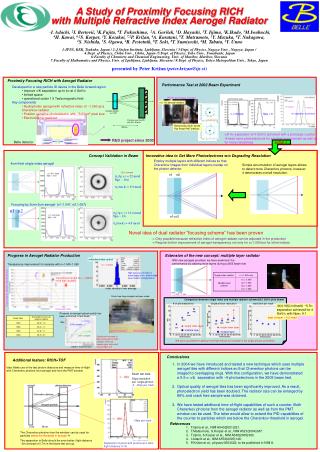
Performance of Aerogel Detectors. Yi Qiang for Pentaquark Experiment Collaboration Meeting March 14, 2005. Outline. Geometry and parameters of A1/A2 detectors Amplitude alignment PID performance. Geometry and Parameters. Aerogel index: A1 1.015 A2 1.055 Radiator area:

E N D
Performance of Aerogel Detectors Yi Qiang for Pentaquark Experiment Collaboration Meeting March 14, 2005
Outline • Geometry and parameters of A1/A2 detectors • Amplitude alignment • PID performance Pentaquark Experiment Collabration Meeting, JLab
Geometry and Parameters • Aerogel index: • A1 1.015 • A2 1.055 • Radiator area: • A1 32X170 cm2 • A2 30X192 cm2 • Radiator thickness: • A1 9 cm • A2 5 cm • PMT types: • A1 RCA8854 24 PMTs • A2 XP4572B 26 PMTs Pentaquark Experiment Collabration Meeting, JLab
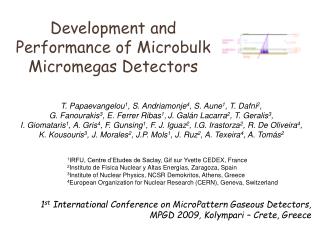
Detector Configuration Pentaquark Experiment Collabration Meeting, JLab
Amplitude Alignment • Typical single photon spectrum • The Alignment makes: • A1 single photon peak = 100 • A2 single photon peak = 60 Pentaquark Experiment Collabration Meeting, JLab
Sliced A1 sum spectrum after alignment Pentaquark Experiment Collabration Meeting, JLab
Particle ID • For index n, the threshold for Cerenkov Radiation is β > 1/n • n(A1) = 0.015 n(A2) = 0.055 Pentaquark Experiment Collabration Meeting, JLab
Fit for A1/A2 sum spectra • Function: Poisson distribution convoluted with Gaussian • Fitted Parameters: • Average N.P.E: μ • Single Photon amplitude deviation: σ Pentaquark Experiment Collabration Meeting, JLab
Puzzle in A1 sum spectra • Unexpected shape in A1 sum • Reason is still under investigation Pentaquark Experiment Collabration Meeting, JLab
Electron A1 sum spectra • Comparison of electron and pion A1 sum spectra at 2.06 GeV/c • From electron spectrum, we have Max N.P.E(A1) = 3.8 Pentaquark Experiment Collabration Meeting, JLab
Momentum Dependence of N.P.E for A1/A2 Pentaquark Experiment Collabration Meeting, JLab The average N.P.E is proportional to: N ~ (1 – 1/β2n2) Max N.P.E at β= 1 Max N.P.E(A1) = 3.8 Max N.P.E(A2) = 14.5
A1 efficiency Pentaquark Experiment Collabration Meeting, JLab Fraction of kaon not firing A1 Using 550 MeV/c pion to simulate kaon condition Fraction of pion not firing A1 e-μ= e-3.8 = 2.2 %
A2 efficiency Pentaquark Experiment Collabration Meeting, JLab Fraction of kaon not firing A2 e-μ= e-9 << 1 Contamination from pion and cut selection
Overall PID performance Pentaquark Experiment Collabration Meeting, JLab • Selection of kaon • Efficiency: 82% • Pion Rejection: 90 • Selection of pion • Efficiency: 98% • Kaon Rejection: 10 • Compare to Original Performance (From Lingyan’s homepage) • N.P.E(A1): 8 → 3.8 • N.P.E(A2): 30 → 14.5