Download
1 / 20
200 likes | 304 Views
The Returns and Risks From Investing (chapter 6 Jones ). Risk and Return. The investment process consists of two broad tasks: security and market analysis portfolio management. Top Down Asset Allocation. 1. Capital Allocation decision: the choice of the

E N D
The Returns and Risks From Investing (chapter 6 Jones )
Risk and Return • The investment process consists of two broad tasks: • security and market analysis • portfolio management
Top Down Asset Allocation 1. Capital Allocation decision: the choice of the proportion of the overall portfolio to place in risk-free assets versus risky assets. 2. Asset Allocation decision: the distribution of risky investments across broad asset classes such as bonds, small stocks, large stocks, real estate etc. 3. Security Selection decision: the choice of which particular securities to hold within each asset class.
Risk and Return • Investors are concerned with both • expected return • risk • As an investor you want to maximize the returns for a given level of risk. • The relationship between the returns for assets in the portfolio is important.
Return Components • Returns consist of two elements: • Periodic cash flows such as interest or dividends (income return) • “Yield” measures relate income return to a price for the security • Price appreciation or depreciation (capital gain or loss) • The change in price of the asset • Total Return =Yield +Price Change
Risk Sources • Interest Rate Risk • Affects income return • Market Risk • Overall market effects • Inflation Risk • Purchasing power variability • Business Risk • Financial Risk • Tied to debt financing • Liquidity Risk • Marketability with-out sale prices • Exchange Rate Risk • Country Risk • Political stability
Risk Types • Two general types: • Systematic (general) risk • Pervasive, affecting all securities, cannot be avoided • Interest rate or market or inflation risks • Nonsystematic (specific) risk • Unique characteristics specific to issuer • Total Risk = General Risk + Specific Risk
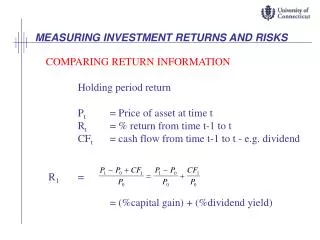
Measuring Returns • For comparing performance over time or across different securities • Total Return is a percentage relating all cash flows received during a given time period, denoted CFt +(PE - PB), to the start of period price, PB • Ex: CF=Div= $1 PB=$10 PE =$11 • TR= (1+11-10)/10=0.2 or 20%
Measuring Returns • Total Return can be either positive or negative • When cumulating or compounding, negative returns are problem • A Return Relative solves the problem because it is always positive • RR = 1+0.2 =1.2
Measuring Returns • To measure the level of wealth created by an investment rather than the change in wealth, need to cumulate returns over time • Cumulative Wealth Index, CWIn, over n periods = • Returns are 10%, 8% and -4% • CWI=$1*(1.1×1.08×0.96)=1.14
Measuring International Returns • International returns include any realized exchange rate changes • If foreign currency depreciates, returns lower in domestic currency terms • Total Return in domestic currency = • PB=10Euro; PE=12Euro RR=1.2 ; • XRB= 1.2$ per Euro; XRE= 1.25 $ per Euro • TR in $= 1.2 x (1.25/1.2] -1 = 25%
Measures Describing a Return Series • TR, RR, and CWI are useful for a given, single time period • W hat about summarizing returns over several time periods? • Arithmetic mean, or simply mean,
Geometric Mean • Defined as the n-th root of the product of n return relatives minus one or G = • Difference between Geometric mean and Arithmetic mean depends on the variability of returns, s
Computing Returns • Arithmetic average return • Example 1: (0.10+0.08-0.04)/3 = 0.0467 or 4.67% • Example 2: (0.50-0.50)/2 = 0 or 0% • Geometric mean return • Example 1: (1.1×1.08×0.96)1/3 – 1 = 0.0448 or 4.48% • Example 2: (1.5×0.5)1/2 – 1 = -0.134 or -13.4%
Arithmetic Versus Geometric • Arithmetic mean does not measure the compound growth rate over time • Does not capture the realized change in wealth over multiple periods • Does capture typical return in a single period • Geometric mean reflects compound, cumulative returns over more than one period • AM is a better measure of expected return next period • GM is a better measure of change in investment value over time
Measuring Risk • Risk is the chance that the actual outcome is different than the expected outcome • Standard Deviation measures the deviation of returns from the mean
Risk Premiums • Premium is additional return earned or expected for additional risk • Calculated for any two asset classes • Equity risk premium is the difference between stock and risk-free returns • Equity Risk Premium, ERP, = • For small RF is approximated to TR -RF
Learning objectives Know the concepts of risk and return. Know the components of return. Know how to calculate average and geometric mean Know how to calculated standard deviation Total Return in domestic terms of investment in foreign currency Risk premiums calculation End of chapter questions 6-1 to 6.14 problems 6.1 and 6.2 NOT on the exam: Cumulative Wealth Indices p 162-165