Download
1 / 28
280 likes | 439 Views
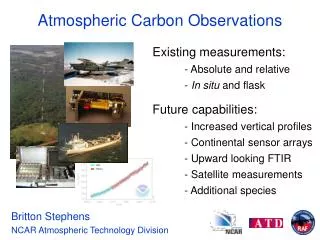
SATELLITE OBSERVATIONS OF ATMOSPHERIC CHEMISTRY. Daniel J. Jacob. OBSERVATION BY SOLAR OCCULTATION (UV to near-IR). “satellite sunrise”. Tangent point; retrieve vertical profile of concentrations. EARTH. Examples: SAGE, GOMOS. Recent extensions to lunar and stellar occultation.

E N D
SATELLITE OBSERVATIONS OF ATMOSPHERIC CHEMISTRY Daniel J. Jacob
OBSERVATION BY SOLAR OCCULTATION (UV to near-IR) “satellite sunrise” Tangent point; retrieve vertical profile of concentrations EARTH Examples: SAGE, GOMOS Recent extensions to lunar and stellar occultation
OBSERVATION BY THERMAL EMISSION (IR, mwave) NADIR VIEW LIMB VIEW elIl(T1) Absorbing gas or aerosol T1 Examples: MLS, MOPITT, MIPAS, TES, HRDLS Il(To) To EARTH SURFACE
OBSERVATION BY SOLAR BACKSCATTER (UV to near-IR) absorption Backscattered intensity IB l1 l2 wavelength Slant optical depth “Slant column” Scattering by Earth surface and by atmosphere EARTH SURFACE Examples: TOMS, GOME, SCIAMACHY, OMI
LIDAR MEASUREMENTS Laser pulse Examples: LITE, CALYPSO backscatter by atmosphere EARTH SURFACE
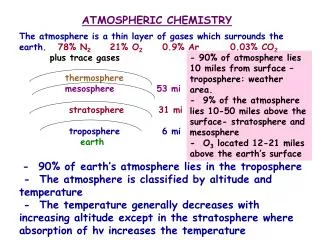
Stratopause Tropopause MOST OBSERVATIONS OF ATMOSPHERIC COMPOSITION FROM SPACE HAVE BEEN FOR THE STRATOSPHERE • Observation of troposphere • is far more difficult because of • clouds • particles (dust) • water vapor continuum • strat ozone layer Mesosphere Stratosphere Ozone layer Troposphere
PRESENT AND FUTURE SATELLITE MEASUREMENTS FOR TROPOSPHERIC CHEMISTRY 2002 2002 2004 2004 2004 2004 2004
ATMOSPHERIC CHEMISTRY MODELS AND SATELLITE OBSERVATIONS: THE ODD COUPLE SATELLITE SPECTRA “L1 DATA” CLIMATOLOGICAL IN SITU OBSERVATIONS A PRIORI INFORMATION vertical gradient, concentration range, correlations… RETRIEVAL ATMOSPHERIC CONCENTRATIONS “L2 DATA” ATMOSPHERIC CHEMISTRY MODELS INCEST? EVALUATION ASSIMILATION INCREASED KNOWELDGE SCIENTIFIC ANALYSIS “L4 DATA”
GEOS-CHEM global model of tropospheric chemistry(www-as.harvard.edu/chemistry/trop/geos) • Driven by NASA GEOS assimilated meteorological data, 1988-2001 • 1ox1.25o- 4ox5o horizontal resolution, 20-48 layers in vertical • Simulation of tropospheric ozone-NOx-hydrocarbon chemistry includes ~80 interacting species
THE GOME SATELLITE INSTRUMENT • Nadir-viewing solar backscatter instrument (237-794 nm) • Low-elevation polar sun-synchronous orbit, 10:30 a.m. observation time • Field of view 320x40 km2, three cross-track scenes • Complete global coverage in 3 days
USE GOME MEASUREMENTS OF NO2 AND HCHO COLUMNSTO MAP NOxAND VOC EMISSIONS GOME Tropospheric NO2 column ~ ENOx Tropospheric HCHO column ~ EVOC ~ 2 km hn (420 nm) BOUNDARY LAYER hn (340 nm) NO2 NO HCHO CO OH hours O3, RO2 hours VOC 1 day HNO3 Emission Deposition Emission NITROGEN OXIDES (NOx) VOLATILE ORGANIC CARBON (VOC)
AIR MASS FACTOR (AMF) CONVERTS SLANT COLUMN WS TO VERTICAL COLUMN W “Geometric AMF” (AMFG) for non-scattering atmosphere: q EARTH SURFACE
Observations Model IN SCATTERING ATMOSPHERE, AMF DEPENDS ON SHAPE OF VERTICAL PROFILE (FOR WHICH GOME PROVIDES NO INFORMATION) SOS (southeast U.S., Jul 1995) NARE (N. Atlantic, Sept 1997) Palmer et al. [2001]
CALCULATE AMF FOR EVERY GOME SCENEUSING LOCAL SHAPE FACTORS FROM GEOS-CHEM GOME efficiency = f (sun angle, albedo, cloud…) Vertical concentration profile shape factor Geometric AMF RADIATIVE TRANSFER MODEL ATMOSPHERIC CHEMISTRY MODEL (GEOS-CHEM) From GOME Slant column Vertical column = AMF From model
ILLUSTRATIVE PROFILE OVER TENNESSEE what GOME sees GOME sensitivity HCHO mixing ratio profile (GEOS-CHEM) AMFG = 2.08 actual AMF = 0.71
SLANT COLUMNS OF NO2 FROM GOMEDominant stratospheric contribution (NO2 produced from N2O oxidation)Also see tropospheric hot spots (fossil fuel and biomass burning) Remove stratospheric column and instrument artifacts using data over Pacific Martin et al. [2002]
SLANT COLUMNS OF TROPOSPHERIC NO2 FROM GOME 1996 Martin et al. [2002]
GOME RETRIEVAL OF TROPOSPHERIC NO2vs. GEOS-CHEM SIMULATION (July 1996) Martin et al. [2002] GEIA emissions scaled to 1996
GOME SPECTRUM (423-451 nm) SLANT NO2 COLUMN TROPOSPHERIC SLANT NO2 COLUMN TROPOSPHERIC NO2 COLUMN PROPAGATION OF ERRORS IN NO2 RETRIEVAL(errors e in 1015 molecules cm-2) Fit spectrum e1 = 0.8 • Use Central Pacific GOME data with: • HALOE to test strat zonal invariance • PEM-Tropics, GEOS-CHEM 3-D model to treat tropospheric residual Remove stratospheric contribution, diffuser plate artifact e2 = 0.4 • Use radiative transfer model with: • local vertical shape factors from GEOS-CHEM • local cloud information from CRAG Apply AMF to convert slant column to vertical column e3 = 0.5-3.2 Martin et al. [2002]
CAN WE USE GOME TO ESTIMATE NOx EMISSIONS?TEST IN U.S. WHERE GOOD A PRIORI EXISTS Comparison of GOME retrieval (July 1996) to GEOS-CHEM model fields using EPA emission inventory for NOx GOME GEOS-CHEM (EPA emissions) BIAS = +3% R = 0.79 R = 0.78 Bias = +18% Martin et al. [2002]
FORMALDEHYDE COLUMNS FROM GOME:July 1996 means Palmer et al. [2001] BIOGENIC ISOPRENE IS THE MAIN SOURCE OF HCHO IN U.S. IN SUMMER GEIA isoprene emissions R = 0.83 Bias 14% Precision: 4x1015 cm-2
SLANT COLUMNS OF HCHO FROM GOMEHigh values over southeast U.S. are due to biogenic isoprene emission Note “isoprene volcano” over the Ozarks Palmer et al. [2002]
DEPENDENCE OF GOME HCHO COLUMNSOVER THE OZARKS ON SURFACE AIR TEMPERATURE Temperature dependence of isoprene emission (GEIA) Palmer et al. [2002]
MODEL AS INTERMEDIARY FOR GOME VALIDATION:EVALUATE AGAINST IN SITU SURFACE OBSERVATIONS Mean daytime HCHO surface observations Jun-Aug 1988-1998 Model (1996) vs. observations Palmer et al. [2002]
USING GOME HCHO COLUMNS TO MAP ISOPRENE EMISSIONS Displacement/smearing length scale 10-100 km hours hours HCHO hn, OH OH isoprene
GEOS-CHEM RELATIONSHIP BETWEEN HCHO COLUMNS AND ISOPRENE EMISSIONS IN N AMERICAUse relationship to map isoprene emissions from GOME observations NW NE GEOS-CHEM July 1996 Model HCHO column [1016 molec cm-2] SW SE model without isoprene Palmer et al. [2002] Isoprene emission [1013 atomC cm-2 s-1]
MAPPING OF ISOPRENE EMISSIONS FOR JULY 1996 BY SCALING OF GOME FORMALDEHYDE COLUMNS [Palmer et al., 2002] GOME COMPARE TO… GEIA (IGAC inventory) BEIS2 (official EPA inventory)
NEXT STEP: GLOBAL MAPPING OF VOC EMISSIONS FROM SPACE! T. Kurosu (SAO) and P. Palmer (Harvard) T. Kurosu (SAO) and P.I. Palmer (Harvard)