Download
1 / 27
270 likes | 287 Views
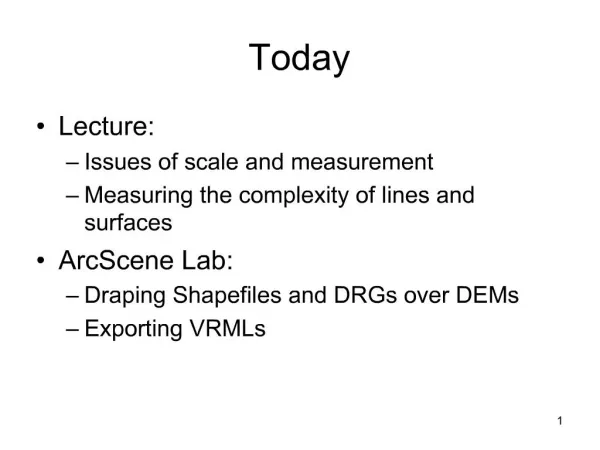
Today. Housekeeping Introduction Prepare an 1% (w/v) agarose gel / (Complete DNA extractions) Background gel electrophoresis Run DNA on the gel (45 min) Spectrophotometry. TOPIC - NAME 1 DNA discovery – Katerina Zlatkin 2 Restriction Enzymes – Nicole Caroll

E N D
Today • Housekeeping • Introduction • Prepare an 1% (w/v) agarose gel / (Complete DNA extractions) • Background gel electrophoresis • Run DNA on the gel (45 min) • Spectrophotometry
TOPIC - NAME 1 DNA discovery – Katerina Zlatkin 2 Restriction Enzymes – Nicole Caroll 3 Southern Blotting – Jonathan Locke 4 Cloning – Kimberly Wright 5 First sequencing methods/gene – Jessie Marlenee 6 BAC Libraries – Alan Buser 7 PCR – Katherine Graf 8 ESTs – John McCready 9 BLAST/GenBank – Zach Potts 10 microarrays – Vincent Cutillas 11 qPCR – Taylor Britton 12 Mitogenomics – Joe Medley 13 Genome sequencing – Ashlynn Bennett 14 forensics – Dante Trujillo 15 NGS – Pankoj Kumar Das 16 bioinformatics – Dillon Dugan (17 C-value paradox, nc RNA - ) 18 epigenetics – Madeline Jeshurin 19 RNAi – Rebeckah Ruiz 20 CRISPR – Matt Johnson 21 Phylogenetic genomics – Mariel Campbell (22 Archeological or commercial genomics -) Schedule on homepage Start in next week Office hours, Wednesdays 11.00-12.00h Castetter 2428
SNAILAND PARASITES BIOLOGY DNA “identity, possibilities” phylogenetics CTAB/DNAzol gel electrophoresis nanodrop spec Illumina (full) genome sequencing Qubit Fluorometry Covaris fragmentation Ampure (fragment collection) Kapa DNA library preparation kit Pippin size selection QC Bioanalyzer, Qubit, qPCR Illumina run PCRrDNA/mito TA cloning, B/W screening electrophoresis Qiagen plasmid extraction Restriction digests direct sequencing M13 sequencing Sequence ID (BLAST) editing Galaxy QC Data file (MT) genome assembly Mitos, manual annotation Gene annotation Primer design, walking Phylogenetics GenBank submission
TARGETED partial hands-on mainstay AND SHOTGUN everything bioinformatics intense (FUTURE IS HERE)
September 25th (Monday) Win7 PC 1/group available Alternative bring your own computer Login to http://emil.unm.edu/galaxy Dr LiJing Bu September 25th, Dr LiJing Bu
DNA extracted? How much and what quality? Concentration, Amount, Contamination, Degradation Good to know for downstream applications several assays available START POURING GELS (steps 1-9 handout) Read, THEN do, check off progress
Horizontal agarose gel electrophoresis “Jello”, 1% agarose in TAE SIDEVIEW TOPVIEW
Horizontal agarose gel electrophoresis Apply DNA in “loading dye buffer”
Horizontal agarose gel electrophoresis Apply voltage DNA DNA DNA DNA short gel vs long gel
Horizontal agarose gel electrophoresis Pulling of DNA by charge through the agarose sieve. Don’t wait too long DNA DNA Well big (long) DNA small (short) DNA dye semi-log separation distance vs MW
Horizontal agarose gel electrophoresis For visualization staining with chemicals that bind DNA (Ethidium bromide, SYBR green, Gel red TOXIC) * * * * DNA * * DNA Post-stain by soaking the gel, put the dye in the gel before the runput the dye in the sample buffer
DNA DNA Horizontal agarose gel electrophoresis UV-activated fluorescence !Careful with UV! Excitation 200-300nm, emission 650nm
The three classes of classic nucleic acid stains include: Intercalating dyes, such as ethidium bromide, propidium iodide, gelred Minor-groove binders, such as DAPI and the Hoechst dyes Other nucleic acid stains, including acridine orange, 7-AAD, LDS 751 and hydroxystilbamidine SPONSOR http://www.invitrogen.com/site/us/en/home/References/Molecular-Probes-The-Handbook/Nucleic-Acid-Detection-and-Genomics-Technology/Nucleic-Acid-Stains.html
http://www.biotium.com/product/product_info/newproduct/gelred_gelgreen.asphttp://www.biotium.com/product/product_info/newproduct/gelred_gelgreen.asp Info on ourwebpage BUT remaincareful!!
TAE versus TBE, a comparison • Both TAE and TBE are the common buffers used for agarose gel electrophoresis to resolve DNA fragments. Each buffer has some advantages and disadvantages, which are given below. • Buffer capability : • TAE has a lower buffer capacity than TBE and it tends to become exhausted during successive electrophoresis. In contrast, TBE has a more stable and higher buffering capacity. • Migration of DNA :Linear, double stranded DNA migrates faster in TAE (approximately 10% faster in compare to TBE). • Resolution of DNA fragments :TAE is suitable for separation of long DNA fragments while TBE is suitable for separation of small DNA fragments. Tris-borate buffer (TBE) is advantageous for obtaining a higher resolution of smaller DNA fragments on agarose gels, when compared to the conventional tris-acetate buffer (TAE). Borate buffer supports agarose cross-linking better than acetate buffer. Better cross-linking improves the sieving properties of agarose. This results in enhanced resolution of smaller DNA fragments. • Recovery of DNA from agarose gel : • Borate forms complex with agarose and nucleic acid. This results in low recovery of DNA from agarose gel. So if one needs to elute the DNA from the agarose gel, TAE will be better choice. • Compatibility with enzyme reaction :Borate is known to be a strong inhibitor for many enzymes. So DNA eluted from Agarose-TBE gel may not be suitable for further enzymatic reaction. • Integrity of DNA : The integrity of DNA sample is better in TBE buffer. This is due to presence of borate ions which can inhibits many enzymes http://bioinfoweb.com/SNDB-TAE-vs-TBE.htm
1 2 3 Interpretation 1) Molecular weight marker, shows fragment size (bp) see website, staining intensity may provide reference for amount of experimental DNA. 2) Good genomic DNA, standard extraction methods yield fragments of 20-50 kbp, RNA may be visible as banding or a smear low in the lane 3) A smear indicates degraded DNA NO signal does NOT mean no DNA!
FLUORESCENT STAINING ng 1000 500 250 100 50 10 Ethidiumbromide drop method (Quantitative binding DNA-EthBr) known amounts DNA compare intensity of sample “dynamic range” is limited Fluorometry “Hoechst dyes” reference sample of known amount sensitive but expensive Qubit Fluorometry 600 ng (Black box)
Spectrometry Chemicals in solution absorb light Depending on the chemical, Some wavelengths are absorbed more than others The amount of light absorbed depends on the concentration,transmission is reduced with increasing concentration
Transmittance and Absorbance I T = ---- = 10 –al = 10 –elc I0 a = absorbance coefficient (molar absorbance x concentration) I A = - log10 T = - log10(----) = - log10(10 –elc ) I0 A = elc The Beer-Lambert Law: A = εlc where A is absorbance, ε is the extinction coefficient (units: M-1cm-1), l is the path length that the light has travelled (units: cm) and c is concentration (units: M). http://en.wikipedia.org/wiki/Beer%E2%80%93Lambert_law
Spectrophotometry of DNA Compound max absorbance Nucleic acids 260 nm Proteins 280 nm Organic solvents 230 nm diluant light (x nm) DNA A 260nm x 50 x dilution = ng/l double stranded DNA A 260nm x 40 x dilution = ng/l single stranded RNA 260/280 ratio of 1.8-2.0 indicates good DNA sample (low protein) watch the A 230nm for organic contamination Half the concentration, half the absorbance
UV spectrophotometric measurement of DNA concentration and purity DNA itself, and most of the common contaminants found in DNA preps, have absorbances in the region 230nm to 320nm so measurement of the absorbances in this region allows measurement of the DNA concentration and provides information about the contaminant levels. The most important wavelengths to note are: 230nm: Guanidium salts (used to facilitate DNA binding to silica columns) and phenol (used in phenol/chloroform extractions) absorb strongly at 230nm, therefore high absorbances at this wavelength can be indicative of carry-over of either of these compounds into the sample. 260nm: DNA absorbs light most strongly at 260nm so the absorbance value at this wavelength (called A260) can be used to estimate the DNA concentration using the equation Concentration (µg/ml) = (A260 reading) × 50 , which is derived from Beer’s Law . 280nm: Since tyrosine and tryptophan residues absorb strongly at this wavelength, the absorbance at 280nm is used as an indicator of protein contamination. 320nm: A320 provides a general measurement of the turbidity of the sample and is normally subtracted from the A260 value as a background reading for the calculation of DNA concentration, but excessive values may indicate non-specific contamination. A good quality DNA sample should have a A260/A280 ratio of 1.7–2.0 and an A260/A230 ratio of greater than 1.5, but since the sensitivity of different techniques to these contaminants varies, these values should only be taken as a guide to the purity of your sample. http://bitesizebio.com/2007/08/22/dna-concentration-purity/
SO, Do you have good/useful DNA samples? Gel results: Spec results: Never throw away samples until you tried PCR