Download
1 / 12
120 likes | 209 Views
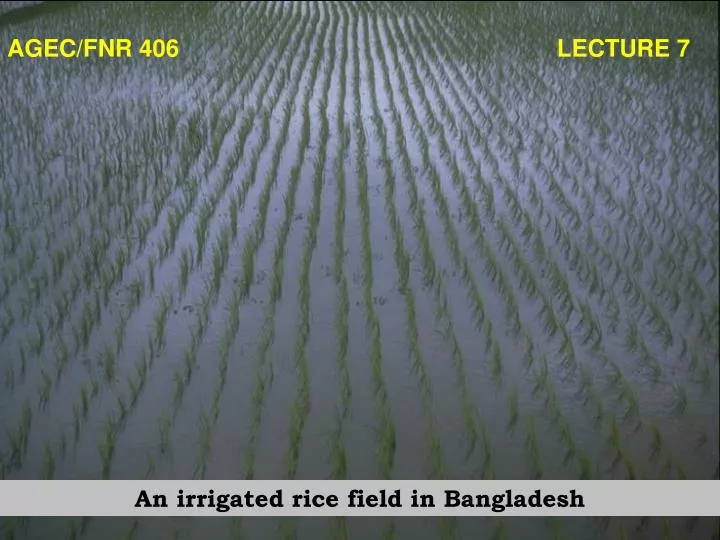
AGEC/FNR 406 LECTURE 7. An irrigated rice field in Bangladesh. Review from last lecture:.

E N D
AGEC/FNR 406 LECTURE 7 An irrigated rice field in Bangladesh
Review from last lecture: The mix of inputs used in production (labor, capital, raw materials) reflects tradeoffs that firms observe in the costs of using inputs. Costs are determined by the technology of production and relative prices of resources.If natural resources are relatively “cheap” and if pollution is not a recognized cost of production, then firms will make profligate use of resources and will not take steps to clean up pollution.
Review from last lecture: Firms seek to use inputs that keep costs low. If policies make the use of some resources more expensive, or if “free disposal” becomes costly, then firms will alter their behavior to avoid costs. This has implications for forming environmental policies.
Profit Profit = Total Revenue - Total Cost = p*Q - pXX = p*f(X) - pXX
Profit maximization: Maximize profit by setting marginal revenue equal to marginal cost: set / X = 0 ==> p f / X = pX i.e. MR = MC
Supply Curve S=MC P The supply curve is the upward sloping portion of the marginal cost curve, above the average cost curve. It measures the incremental private cost of producing additional units of the good. Q
Supply Curve The upward slope reflects diminishing returns to input use. The shape of the supply curve is determined by the technology of production. The area under the supply curve is the measure of the total cost of resources used to produce that level of output. P S Q
Changes in supply A shift in supply can result from either: 1. A change in input prices 2. Technological innovation P S • • • • Q
Some problems with the storyof static profit maximization P S 1. Externalities 2. Depletion over time 3. Ecological dynamics Q
Example 1: Externality Corn = f (land, labor, fertilizer) Nitrogen loads = g(fertilizer) Hypoxia = h(nitrogen loads) Impact of fertilizer on hypoxia is ignored when decision about fertilizer use is made by a corn farmer.
Example 2: Depletion over time Cornt = f (landt, labort, fertilizert) Cornt+1 = f (landt+1, labort+1, fertilizert+1) Impact of changes in land quality on production at time t+1 may ignored when land use decisions are made at time t.
Example 3: Ecology QFish = f (effort, current fish population) Feed back loop The population dynamics of the resource may be complicated and poorly understood when harvesting decisions are made.