Download
1 / 59
590 likes | 715 Views
Global modelling of aerosols and the UKCA project. Graham Mann NERC Centres for Atmospheric Science (NCAS). Acknowledgements Ken Carslaw, Dominick Spracklen, Kirsty Pringle, Martyn Chipperfield,. Aerosols. Definition : suspension of fine solid or liquid matter in a gas

E N D
Global modelling of aerosols and the UKCA project Graham Mann NERC Centres for Atmospheric Science (NCAS). Acknowledgements Ken Carslaw, Dominick Spracklen, Kirsty Pringle, Martyn Chipperfield,
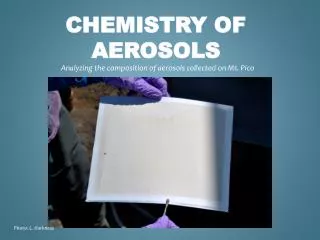
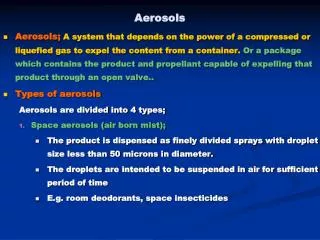
Aerosols • Definition : suspension of fine solid or liquid matter in a gas • Commonly : just particulate component • Primary aerosol --- emitted directly (e.g. dust, sea spray, smoke, soot) • Secondary aerosol --- formed in the atmosphere from gas to particle conversion (e.g. sulfates, organic aerosol)
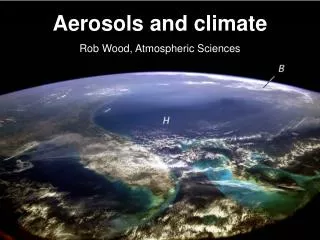
Why interested in aerosols? • Adverse health effects --- exascerbate asthma, causes lung & heart disease • Scatter & absorb solar/terrestrial radiation --- direct effect on earth’s climate • Act as cloud condensation nucleii (CCN) --- indirect effects on climate (albedo, lifetime) • Absorbing aerosol --- semi-direct effect.
Aerosol semi-direct effect ? Very low - undeveloped From IPCC (2001)
Adapted from Raes (2000) (courtesy, K. Pringle) Emission of gas phase precursors Emission of primary particles In-cloud oxidation Activation of CCN Coagulation Nucleation Gaseous precursors Out of cloud processing Condensation Wet Deposition Dry Deposition ~1.E-9 m Particle Size ~50.E-6 m
Aerosol size distribution Affected by ● aerosol emissions ● precursor emissions ● aerosol microphysics ● gas phase chemistry ● aqueous chemistry ● dry deposition ● wet deposition Figure from Seinfeld & Pandis.
Global modelling of aerosols • Aerosol is transported between different compartments of the earth’s atmosphere -- models need to be 3D and global • Radiative properties of aerosols depend critically on their size and composition -- models need to include “adequate” representation of “important” processes
Aerosol Box Model Chemical Box Model Observations Global 3-D Chemical Transport Model Global 3-D Aerosol Transport Model Climate Model Climate Model
The GLOMAP Model • TOMCAT • 3D Offline CTM • Forced by ECMWF Winds • Convective transport • Convective and resolved rain Introduction • GLOMAP (single-cpt) • Aerosol size spectrum (~ 1 nm – 24 mm) • Two-moment sectional scheme • 20 bins in ptcl number & average mass Sources Microphysics Removal • Dry Deposition • Dry deposition of aerosol • Emissions • Anthrop + volcanic SO2 emissions • DMS emissions from wind stressand DMS sea surface concentration • Sea salt aerosol generation function • Nucleation and Condensation • Binary H2SO4/H2O nucleation • Condensational growth • Clouds • Convective and frontal rain • In-cloud nucleation scavenging • Belowcloud scavenging • Coagulation • Semi implicit fast numerical solution • Sulfur Chemistry • 8 sulfur species, 8 sulfur reactions • Aqueous phase chemistry • Oxidants from full chemistry run Spracklen et al (2004) • Hygroscopic Growth • Equilibrium size given by solution of Kohler equation
Emissions in GLOMAP single-cpt Elevated SO2ems Surface DMSconc. VolcanicSO2ems Surface SO2ems
Cloud fields used in GLOMAP 900 1.0 0.5 800 700 0.0 Low cloud amount (fraction)(December 1995 shown here) Cloud-top pressure (hPa)(December 1995 shown here) • Uses monthly mean low cloud fields from ISCCP archive • Uses low cloud amount and cloud top pressure (assume base at 1km) to give volume fraction of grid box in cloud.
GLOMAP bin-resolved scheme dN dlogr log r • “two-moment” sectional scheme carrying particle number & mass for each bin (20 for T42L31 run) • nucleation, coagulation, condensation etc. change no./mass and consequently change size distribution
UKCA project • Collaboration between the Met Office, University of Cambridge and University of Leeds. • Develop new chemistry and aerosol schemes for inclusion in the next generation Met Office climate model • UKCA = UK Chemistry & Aerosols model • Funded through NCAS.
Leeds part in UKCA • Primarily responsible for development and evaluation of a new aerosol microphysics scheme • Develop new UM aerosol scheme inside the framework of TOMCAT Chemistry Transport Model • Evaluation against GLOMAP ‘full’ bin-resolved aerosol microphysics scheme (also within TOMCAT) • Evaluation against observations • Approach takes advantage of • Speed of TOMCAT versus UM (development and run-time) • Analysed winds in TOMCAT (easier comparison with obs.) • Familiarity with model
Current UM aerosol scheme • sulfate, elemental carbon, dust, sea salt (radiation only) • sulfate scheme: • aerosol mass carried in 3 log-normal modes (Aitken, accumulation, dissolved) • inter-modal exchange by parameterized processes but median radius & standard deviation fixed for each mode
Unified Model Sulfur Cycle Species included: • Gas phase : DMS, SO2 , MSA • Aerosol : SO4 • Aitken mode (rmedian=24nm; σ=1.45) • Accumulation mode (rmedian=95nm; σ=1.4) • Dissolved Separating into modes allows very basic representation of size-dependent processes Size information is currently discarded however when CCN number is calculated from total mass in 3 modes (& sea salt) -- assumes all nss-SO4 mass in 1 mode (rmedian=50nm, s=2.0)
Land- Based emissions Marine emissions Slide(s) courtesy of Jamie Rae (Met Office) DMS SO2
Natural emissions Land- Based emissions Marine emissions Slide(s) courtesy of Jamie Rae (Met Office) DMS SO2
Low-level Anthropo- genic emissions High-level Anthropo- genic emissions Natural emissions Land- Based emissions Marine emissions Slide(s) courtesy of Jamie Rae (Met Office) DMS SO2
Low-level Anthropo- genic emissions High-level Anthropo- genic emissions Natural emissions Land- Based emissions Marine emissions Slide(s) courtesy of Jamie Rae (Met Office) Dry oxidation processes involving OH, O3, and HO2 DMS SO2
Low-level Anthropo- genic emissions High-level Anthropo- genic emissions Natural emissions Land- Based emissions Marine emissions Slide(s) courtesy of Jamie Rae (Met Office) Dry oxidation processes involving OH, O3, and HO2 DMS SO2 MSA
Low-level Anthropo- genic emissions High-level Anthropo- genic emissions Natural emissions Land- Based emissions Marine emissions Slide(s) courtesy of Jamie Rae (Met Office) Dry Dep Dry oxidation processes involving OH, O3, and HO2 DMS SO2 Wet Dep MSA
Low-level Anthropo- genic emissions High-level Anthropo- genic emissions Natural emissions Land- Based emissions Marine emissions Slide(s) courtesy of Jamie Rae (Met Office) Dry Dep Dry oxidation processes involving OH, O3, and HO2 DMS SO2 Wet Dep MSA Dry oxidation by OH SO4 Acc SO4 Aitken
Low-level Anthropo- genic emissions High-level Anthropo- genic emissions Natural emissions Land- Based emissions Marine emissions Slide(s) courtesy of Jamie Rae (Met Office) Dry Dep Dry oxidation processes involving OH, O3, and HO2 DMS SO2 Wet Dep MSA Wet oxidation by H2O2 and O3 Dry oxidation by OH SO4 Diss SO4 Acc SO4 Aitken
Low-level Anthropo- genic emissions High-level Anthropo- genic emissions Natural emissions Land- Based emissions Marine emissions Slide(s) courtesy of Jamie Rae (Met Office) Dry Dep Dry oxidation processes involving OH, O3, and HO2 DMS SO2 Wet Dep MSA Wet oxidation by H2O2 and O3 Dry oxidation by OH SO4 Diss SO4 Acc SO4 Aitken Wet Dep Wet Dep Wet Dep Dry Dep Dry Dep Dry Dep
Low-level Anthropo- genic emissions High-level Anthropo- genic emissions Natural emissions Land- Based emissions Marine emissions Slide(s) courtesy of Jamie Rae (Met Office) Dry Dep Dry oxidation processes involving OH, O3, and HO2 DMS SO2 Wet Dep MSA Wet oxidation by H2O2 and O3 Dry oxidation by OH SO4 Diss Nucleation SO4 Acc SO4 Aitken Coagulation Evaporation Wet Dep Wet Dep Wet Dep Dry Dep Dry Dep Dry Dep Diffusion
UM fixed-mode scheme dN dlog r log r • single-moment modal scheme • mass per mode prognosed (number diagnosed) • No new particle formation, oxidised SO2 partitioned between Aitken and accumulation mode by surface area.
Required developments identified by UKCA • Dynamical evolution of the size distribution • Nucleation, improved coagulation, size-resolved aerosol removal • Internally mixed particles (e.g., SO4 & dust) • Additional constituents • e.g. Ammonium, nitrate, secondary organics • Improved CCN calculation
Progress so far • Incorporated existing UM sulfate aerosol scheme within TOMCAT framework • Compared aerosol size distributions from UM scheme with GLOMAP scheme for equivalent standard runs. • Compared response of two schemes to changing anthropogenic SO2 emissions.
GLOMAP vs UM size distribution comparison • Spun-up from an aerosol-free atmosphere, October – December 1995 at T42 (2.8o x 2.8o) horizontal resolution, 31 vertical levels • GLOMAP --- sectional sulfate & sea salt scheme --- 20 bins of no. & mass. • UM --- 3-mode sulfate aerosol scheme used with O’Dowd sea-salt scheme. • Equivalent emissions of SO2, DMS & sea-salt, oxidant (OH, H2O2, NO3) & cloud fields, precipitation rates and gas phase chemistry schemes • More sophisticated aqueous phase oxidation scheme in GLOMAP (cloud droplet spectrum produced for assumed cloud water content) • No nucleation in Hadley centre scheme, condensation parameterized by Aitken/accum surface area ratio and coagulation treatment very basic. • Both runs have same aerosol dry deposition but aerosol wet removal only by in-cloud scavenging in UM run (BCS considered insignificant by UM)
Surface DMS,SO2,OH,H2O2 maps 103 104 DMS(ppt) 102 103 SO2(ppt) 102 101 100 101 100 103 10-1 102 H2O2(ppt) OH(ppt) 101 10-2 10-3 100
Surface size modes (UM) 103 103 102 102 Aitken(per cc) accum.(per cc) 101 101 100 100 103 103 sea salt(per cc) 102 102 dissolved(per cc) 101 101 100 100
Surface size sections (UM) 103 103 Dp<10nm(per cc) 102 102 100>Dp>10nm(per cc) 101 101 100 100 102 103 101 Dp>1mm(per cc) 0.1<Dp<1mm(per cc) 102 100 101 10-1 100
Surface size sections (GLOMAP) 103 103 Dp<10nm(per cc) 102 102 100>Dp>10nm(per cc) 101 101 100 100 102 103 101 Dp>1mm(per cc) 0.1<Dp<1mm(per cc) 102 100 101 10-1 100
Surface N [per cc] (10<Dp<100nm) 103 103 102 102 101 101 100 100 UM scheme GLOMAP scheme
Surface N [per cc] (0.1<Dp<1mm) 103 103 102 102 101 101 100 100 UM scheme GLOMAP scheme
Surface N [per cc] (Dp>1mm) 102 102 101 101 100 100 10-1 10-1 UM scheme GLOMAP scheme
Atlantic MBL, FT size distributions UM schemeGLOMAP schemeRaes observations MBL (surface box) (0- ~60m)
820hPa size modes (UM) 103 103 102 102 Aitken(per cc) accum.(per cc) 101 101 100 100 103 103 sea salt(per cc) 102 102 dissolved(per cc) 101 101 100 100
820hPa size sections (UM) 103 103 Dp<10nm(per cc) 102 102 100>Dp>10nm(per cc) 101 101 100 100 102 103 101 Dp>1mm(per cc) 0.1<Dp<1mm(per cc) 102 100 101 10-1 100
820hPa size sections (GLOMAP) 103 103 Dp<10nm(per cc) 102 102 100>Dp>10nm(per cc) 101 101 100 100 102 103 101 Dp>1mm(per cc) 0.1<Dp<1mm(per cc) 102 100 101 10-1 100
820hPa N [per cc] (10<Dp<100nm) 103 103 102 102 101 101 100 100 UM scheme GLOMAP scheme
820hPa N [per cc] (0.1<Dp<1mm) 103 103 102 102 101 101 100 100 UM scheme GLOMAP scheme
820hPa N [per cc] (Dp>1mm) 102 102 101 101 100 100 10-1 10-1 UM scheme GLOMAP scheme
820hPa size distributions Atlantic Arabian Sea S. America (coast) S. Ocean China (continent) China (ocean) Europe N. Pacific E. USA UM schemeGLOMAP scheme
MBL aerosol observations Heintzenberg (2004) Probability UM scheme
MBL aerosol observations Heintzenberg (2004) Probability GLOMAP
Initial comparison with MBL obs. • Observations & GLOMAP scheme consistently indicate more smaller aerosol (r<100 nm) cf UM. • Seems to be because UM partitioning of dry oxidised SO2 (representation of condensation) does not include competition with new particle formation. • New scheme needs to include a nucleation mode as seems to significantly influence the number of aerosol reaching CCN sizes.
Investigate response to reduced sulfur emissions for 2 schemes • GLOMAP and UM run spun-up for 30 days with all emissions on and then run on for 16 days with anthropogenic SO2 emissions reduced by 0-100%. • How do different representations of aerosol size distribution respond to reduced sulfur emissions?