Download
1 / 1
10 likes | 145 Views
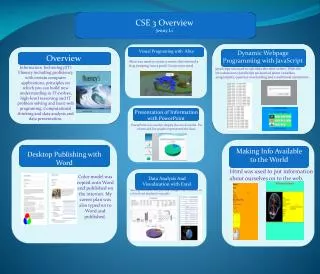
CSE 3 Overview Jenny Li. Visual Programing with Alice. Dynamic Webpage Programming with JavaScript. Overview. Alice was used to create a movie that showed a frog jumping into a pond. Loops were used.

E N D
CSE 3 Overview Jenny Li Visual Programing with Alice Dynamic Webpage Programming with JavaScript Overview Alice was used to create a movie that showed a frog jumping into a pond. Loops were used. Information Technology(IT) Fluency including proficiency with certain computer applications, principles on which you can build new understanding as IT evolves, high-level reasoning and IT problem solving and basic web programing. Computational thinking and data analysis and data presentation. JavaScript was used to calculate the shirt orders. With the introduction to JavaScript we learned about variables, assignments, operator overloading and conditional statements. Presentation of Information with PowerPoint PowerPoint was used to display the stock results. Pie charts and bar graphs represented the data. sfsf Making Info Available to the World Desktop Publishing with Word Html was used to put information about ourselves on to the web. Color model was copied onto Word and published on the internet. My career plan was also typed on to Word and published. Data Analysis And Visualization with Excel Stock performance and personal budgets were inputted on to Excel and displayed in graphs dfd