Download
1 / 31
320 likes | 463 Views
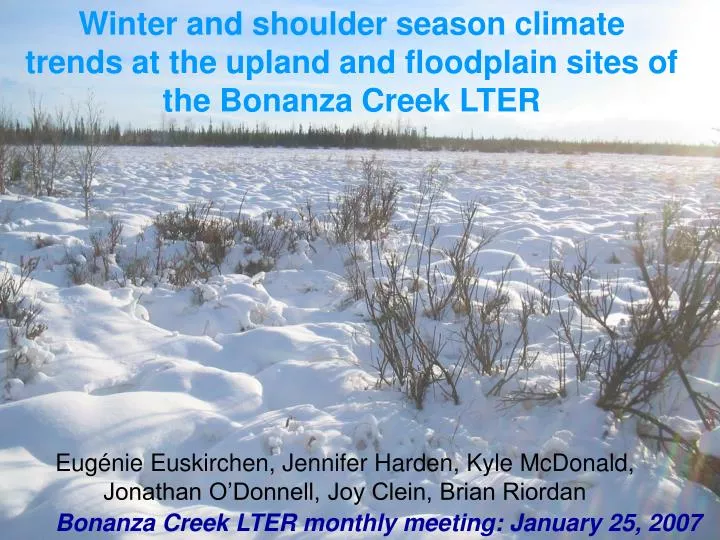
Winter and shoulder season climate trends at the upland and floodplain sites of the Bonanza Creek LTER. Eug é nie Euskirchen, Jennifer Harden, Kyle McDonald, Jonathan O’Donnell, Joy Clein, Brian Riordan . Bonanza Creek LTER monthly meeting: January 25, 2007. Motivation I

E N D
Winter and shoulder season climate trends at the upland and floodplain sites of the Bonanza Creek LTER Eugénie Euskirchen, Jennifer Harden, Kyle McDonald, Jonathan O’Donnell, Joy Clein, Brian Riordan Bonanza Creek LTER monthly meeting: January 25, 2007
Motivation I • Bonanza Creek LTER has data for >15 years regarding air temperature, soil temperature, and snowpack. • Recent studies at various spatial scales in high latitudes have found • increases in air temperature, • decreases in snow cover, • an earlier date of soil thaw, • a later date of soil freeze, and • a longer growing season during the past several decades. • Do we see similar trends at Bonanza Creek?
Motivation II • Bonanza Creek LTER also has two classes of landscapes: • 1. well-drained uplands • 2. moderately to (somewhat) • poorly-drained lowlands • Recent studies at in boreal forests have found that compared to poorly drained soils: • well-drained soils have warmer surface temperatures during the growing season • well-drained mineral soils have earlier soil thaw dates • Do we see similar trends at Bonanza Creek?
QuestionsI. Do we see trends in air temperature, snow cover, and soil temperature over the past ~15 years?II. Are trends different between the uplands & the floodplains?III. To what extent are these results representative of Interior Alaska?
Strategy (outline for rest of talk) • A . Examine trends over time in: • Air Temp, Soil temp, snowpack, soil thaw, freeze-up • Specifically For: • Early winter (Oct/Nov) • Mid-winter (Dec/Jan/Feb) • Late winter (Mar/Apr) • B. Examine thaw, freeze-up dates and growing season length (e.g., period of unfrozen ground) among uplands versus floodplains
Site Selection: BC LTER Note: Litter/O may change over time Exact depths to be re-measured at probe sites
Root Abundance in Uplands and Floodplains Root abundance index (Harden, unpub.) from Ping et al, soil descriptions at BZ LTER
160 140 120 100 Xylem Flux Initiation, Julian Date 90 100 120 140 160 Soil Thaw, Julian Date Continuous Continuous Intermittent Intermittent Xylem Flux Xylem Flux Finish Start Start Finish Thaw at 10cm Thaw of Litter K.C.McDonald in prep 2007 BC LTER White Spruce X=Y line is Best Proxy for onset of growing season (litter, 10 cm important)
Continuous Intermittent Continuous Xylem Flux Intermittent Start Finish Xylem Flux Finish Start Thaw of Litter Thaw at 10cm K.C.McDonald, in prep. 2007 BC LTER Black Spruce 160 140 120 100 X=Y line is Best proxy for onset of growing season (only litter important) Xylem Flux Initiation, Julian Date 90 100 120 140 160 Soil Thaw, Julian Date
Data Status and Data Quality Temperature: Screened data for outliers: checked that data were not out of range (e.g., that diurnal minimums and maximums were not drastically far apart, unrealistic values, etc.) Snow: Determined that data were not out of range (if collected continuously)
Determination of “thaw and freeze dates” Note – phase changes are evident in ‘flat lines’ that directly precede thaw or freeze
Trends in Air Temperature: Summer & Spring Floodplain weather station, mowed area All sites
Trends in Air Temperature: Winter & Fall Floodplain weather station, mowed area All sites
Decreases in mean daily minimum soil temperatures: Early winter Uplands Floodplains Mean daily minimum (ºC)
Significant decreases in mean daily minimum soil temperatures: Mid-winter Mean daily minimum (ºC)
Significant decreases in mean daily minimum soil temperatures: Late winter Uplands Floodplains Mean daily minimum (ºC)
Snow depth (cm) Decreases in snow depth Early winter Mid-winter Late winter
Uplands Floodplains Late winter Early winter Mid-winter Snow depth versus soil temperature Mean daily minimum soil temp. (ºC, 5 cm depth) Snow depth (cm)
Mean day of thaw (various depths) No significant trends in any of the time series. Uplands Floodplains Day of thaw
Day of freeze Mean day of soil freeze (various depths) No significant trends in any of the time series. Uplands Floodplains
Upland sites: Decrease in growing season length ??? Slope suggests a loss of about 2 days per decade (no trend at 5 cm depth) For 10 and 20 cm depths: R2 = 0.3, p < 0.05 Number of days of unfrozen ground** **Obtained by subtracting the Julian day of freeze from the Julian day of thaw.
Floodplain sites: (no trend at 10 and 20 cm depth) Number of days of unfrozen ground** **Obtained by subtracting the Julian day of freeze from the Julian day of thaw.
Mean day of soil thaw between 1989 - 2005 Uplands Floodplains 5 cm depth 10 cm depth 20 cm depth Julian day
Mean day of soil freeze between 1989 - 2005 Uplands Floodplains 5 cm depth 10 cm depth 20 cm depth Julian day
Mean number of days of unfrozen ground between 1989 - 2005 Uplands Floodplains Julian day 5 cm depth 10 cm depth 20 cm depth
Revisiting our QuestionsI. Trends over time 1. Less snow in early and mid winter 2. Colder night-time soil temperatures (as a result of snow) 3. Changes in # days of unfrozen soil Role of snow #1-2 likely causative: Less snow has led to colder (nighttime) soil temperatures over the past 15-20 years Impact of thaw? There are no trends in the timing of soil thaw or freeze-up, however… Changes in the period of frozen ground? …. There were small enough trends in each such that the period of frozen ground may be changing (interactive effect for sites – see next slide)
Revisiting our Questions II Differences between uplands and lowlands -Both uplands and floodplains show: -similar significant decreases in soil temperatures & snow depth -no trends in soil thaw or soil freeze days individually -Earlier soil thaw (only slightly) & earlier soil freeze in the floodplains compared to uplands - Growing season trends: Shorter period of unfrozen ground in the uplands (result of night-time winter temps cooling?) Longer period of unfrozen ground in the lowlands (result of air temperature warming?)
0.00-1.00 1.01-2.95 2.96-3.90 3.91-5.05 5.06-5.90 5.91-6.86 Revisiting our QuestionsIII. Representative of Interior Alaska? Weighted Drainage Class Dry (Gravelly) -Soil Drainage Class: ~ 40% of Interior is class > 4 -BZ LTER 100, 200 are classes 2 – 4 -BZ LTER 250s are not well instrumented (LTER 100s) (LTER 200s) (LTER 250s) Wet (Fens,Lakes)
Questions and Issues for BC LTER: • Black spruce with thick O horizons under-represented in database • Soil moisture important for timing of thaw, seasonal moisture balance • Depth of O horizons (with litter) need to be measured every 1-2 yrs at LTER sites where probes are located • Moisture and temperature probes needed in O horizons because there are so many roots there
Probe Issues O O (20 – 25 cm thick) (2 – 9 cm thick) O (2 – 5 cm thick) 25 to 30 cm deep 7 to 10 cm deep 7 to 14 cm deep Well Drained Moderately Drained Poorly Drained