Download
1 / 1
10 likes | 96 Views
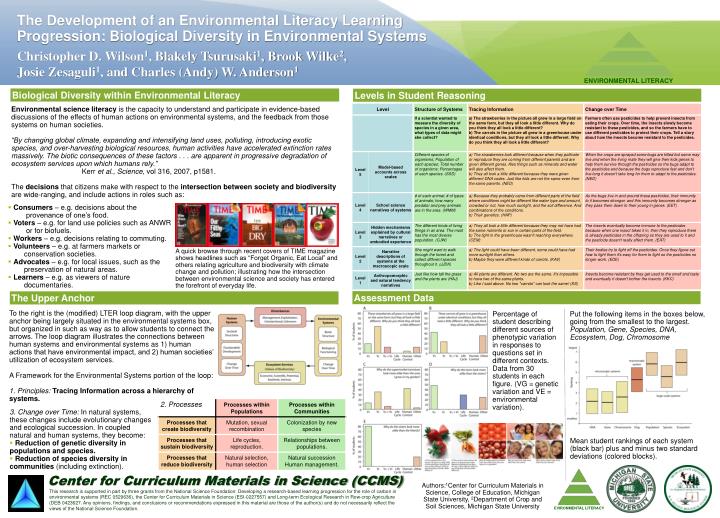
The Development of an Environmental Literacy Learning Progression: Biological Diversity in Environmental Systems. Christopher D. Wilson 1 , Blakely Tsurusaki 1 , Brook Wilke 2 , Josie Zesaguli 1 , and Charles (Andy) W. Anderson 1. Biological Diversity within Environmental Literacy.

E N D
The Development of an Environmental Literacy Learning Progression: Biological Diversity in Environmental Systems Christopher D. Wilson1, Blakely Tsurusaki1, Brook Wilke2, Josie Zesaguli1, and Charles (Andy) W. Anderson1 Biological Diversity within Environmental Literacy Levels in Student Reasoning Environmental science literacy is the capacity to understand and participate in evidence-based discussions of the effects of human actions on environmental systems, and the feedback from those systems on human societies. “By changing global climate, expanding and intensifying land uses, polluting, introducing exotic species, and over-harvesting biological resources, human activities have accelerated extinction rates massively. The biotic consequences of these factors . . . are apparent in progressive degradation of ecosystem services upon which humans rely.” Kerr et al., Science, vol 316, 2007, p1581. The decisions that citizens make with respect to the intersection between society and biodiversity are wide-ranging, and include actions in roles such as: • Consumers – e.g. decisions about the provenance of one’s food. • Voters – e.g. for land use policies such as ANWR or for biofuels. • Workers – e.g. decisions relating to commuting. • Volunteers – e.g. at farmers markets or conservation societies. • Advocates – e.g. for local issues, such as the preservation of natural areas. • Learners – e.g. as viewers of nature documentaries. A quick browse through recent covers of TIME magazine shows headlines such as “Forget Organic, Eat Local” and others relating agriculture and biodiversity with climate change and pollution; illustrating how the intersection between environmental science and society has entered the forefront of everyday life. Assessment Data The Upper Anchor To the right is the (modified) LTER loop diagram, with the upper anchor being largely situated in the environmental systems box, but organized in such as way as to allow students to connect the arrows. The loop diagram illustrates the connections between human systems and environmental systems as 1) human actions that have environmental impact, and 2) human societies’ utilization of ecosystem services. A Framework for the Environmental Systems portion of the loop: 1. Principles:Tracing Information across a hierarchy of systems. Percentage of student describing different sources of phenotypic variation in responses to questions set in different contexts. Data from 30 students in each figure. (VG = genetic variation and VE = environmental variation). Put the following items in the boxes below, going from the smallest to the largest. Population, Gene, Species, DNA, Ecosystem, Dog, Chromosome • 3. Change over Time: In natural systems, these changes include evolutionary changes and ecological succession. In coupled natural and human systems, they become: • Reduction of genetic diversity in populations and species. • Reduction of species diversity in communities (including extinction). Mean student rankings of each system (black bar) plus and minus two standard deviations (colored blocks). Authors:1Center for Curriculum Materials in Science, College of Education, Michigan State University, 2Department of Crop and Soil Sciences, Michigan State University