Download
1 / 14
140 likes | 251 Views
POLITICS VERSUS SCIENCE OPPOSING THE FOOD PYRAMID, 1991-1992. Chapter 2, In The Book: “Food Politics: How the Food Industry Influences Nutrition and Health” By: Marion Nestle Presented By: Samantha Privratsky. The Food Industry Influences Nutrition and Health Through Food Guidelines.

E N D
POLITICS VERSUS SCIENCEOPPOSING THE FOOD PYRAMID, 1991-1992 Chapter 2, In The Book: “Food Politics: How the Food Industry Influences Nutrition and Health” By: Marion Nestle Presented By: Samantha Privratsky
The Food Industry Influences Nutrition and Health Through Food Guidelines Conflict of interest by USDA (United States Department of Agriculture) when aiming to protect agriculture AND to advise the public about diet and health issues Marion Nestle exemplifies this issue through her analysis of the 1991 Food Pyramid Controversy
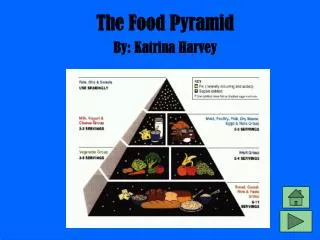
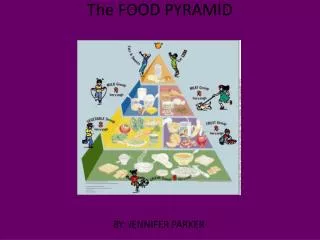
1991: Opposing The Food Pyramid (1991)USDA Secretary, Edward R. Madigan, rejected the Printing of the latest, TheEating Right Food Pyramid, because he claimed that, “It is confusing to Children.”
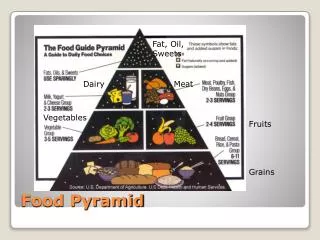
(1956-1979)The Basic FourGuide (1991) The Eating Right Pyramid • Servings: (some serving sizes unknown) • Meat = 2-3 servings • Milk = 2-3 cups • Vegetables = 3-5 servings • Fruit = 2-4 • Grain = 6-11 • Explicitly hierarchical: majority of foods from grain, vegetables, fruit; image suggests eating less meat and dairy than the other food groups • The relative size unity suggests that a person should eat an equal amount of all four food groups, even if the suggested servings read differently • Servings(some serving sizes unknown): • Meat 2-3 servings; 4-6 ounces/servng • milk 2-3 cups; • Vegetables/Fruit = 4 or more • Grain = 4 or more
Out with the Old - In with the New USDA modified Pyramid In 1992 the USDA came out with a revised image of the “Eating Right” Pyramid after 1 year of further research and incessant publicity Spent 1 Million Dollars only to confirm the previous research conducted by the DHEW: Even though the meat and dairy producers preferred the Bowl image guidelines because the shape suggested greater equality among food groups, Research showed the pyramid image providing the most clarity and understanding for the general public Only a few changes were made to The Eating Right Pyramid and yet the USDA secretary justified the costs, “We spent 855,000 on comprehensive tests to answer concerns raised by commodity groups, nutritionists, and health care professionals…..The results clearly indicate that the “Food Guide” was the most effective symbol” (Secretary Madigan, April, 28, 1992).
(1992)The Final Product • Changes made on image from 1991-1992: • Title (‘Eating Right’ to ‘Food Guide’) due to Complaints from Kraft Foods • Recommended servings located outside the pyramid and not within food groups • Increase in meat serving size: “Basic Four” = 4-6oz • “Food Guide” = 5-7oz THE FOOD GUIDE PYRAMID (1992)
Building the Pyramid: Researching an “Eat Less” Food Guide 1977 Dietary Goals, Congress Under Pressure to support Health promotion : to reduce chronic disease(Heart Disease, Diabetes, etc..) prevent public nutrition deficiencies reduce the cost of healthcare USDA and DHEW (Department of Health, Education, and Welfare) were competing for the control of nutrition education and research USDA won this battle with the help of President Jimmy Carter, a Democrat ,who wanted control over these issues
Building the Pyramid: Researching an “Eat Less” Food Guide:USDA Gains Power Over Public Health Dietary Guidelines (1977) Farm Bill (Public Law 95-113), Congress granted USDA shared responsibilities over dietary advice to the public with DHEW(Department of Health, Education, and Welfare) (1988)House Appropriations Committee reaffirmed USDA’s “lead agency” responsibility for dietary guidance DHEW argued that more “appropriate” agencies , which work within the DHEW, should be responsible for education and research on diet and health, Agencies such as: Food and Drug Administration (FDA) Center for Disease Control (CDC) National Health Institute of Health
Building the Pyramid: Researching an “Eat Less” Food Guide: Origins of the Pyramid USDA’s Human Nutrition Information Service (HNIS) (1980 )Developed a Food Wheel Dietary Guideline based off of serving size and daily servings per food group, however; the food industry requested to downplay any “eat less” suggestions (1988-89) developed the Pyramid symbol to focus on eating a variety of foods and not on “eating less” Research , focus groups, showed that participants easily caught on to the proportionality concept: people knew just by looking at the pyramid that they were supposed to eat more servings of bread than dairy The HNIS conducted nearly 10 years of extensive research Pyramid Food Guide had passed six levels of USDA policy review and three divisional reviews; it was fully cleared for publication at every political level within USDA Why did Secretary Madigan block the printing of the “Eating Right Pyramid?”
Toppling the Pyramid: A day by day streak of bad luck Wednesday, April 10th: “Eat Less Meat” Front page news due to Physicians Committee for Responsible Medicine(PCRM) advocating for four new vegetarian food groups. April 13th: publicity highlighting the “progress” achieved creating the Pyramid symbol because it suggests that we eat less meat and dairy and therefore will increase our health and wellbeing April 15th: Secretary Madigan scheduled a meeting with the Cattlemen’s association two days after the Washington Post story appeared. Cattlemen among other trade associations were not content with their position on the pyramid and argued that it would negatively affect their business
Survival of the Pyramid: Implications Now Appears as an Icon, in education, nutrition, textbooks, but also in advertisements, cookbooks etc…. The pyramid has developed food pyramids for ethnic and cultural groups to suit almost any dietary preference The Food Pyramid has not shown to be effective in meeting the 1977 “Dietary Goals” and lowered healthcare costs goals set by the USDA, therefore, further research is necessary.
1980-1991 Eating Right Pyramid 1956-1979 Basic Four 1992-2005 The Food Guide Pyramid 2005 Food Pyramid
Latest News with USDA and Food Pyramid Website for MyPyramid contains a link to the new “Know your Farmer, know your Food” Obama Administration giving funds to support local food within schools and in communities to benefit local farmers Also funds to support EBT low income cards so they can have access to farmers markets and healthy local food. There are many other food pyramid spin offs from the original 1992, and 2005 versions which are specifically science based anddo not agree with the USDA versions.
USDA Initiative:KNOW YOUR FARMER,KNOW YOUR FOOD http://www.usda.gov/wps/portal/knowyourfarmer?navtype=KYF&navid=KYF_MISSION