Download
1 / 32
320 likes | 401 Views
The longitude of the Mediterranean along history. Luis A. Robles Macías luis.a.robles.macias@gmail.com 24 th International Conference on the History of Cartography Moscow, July 2011. Introduction. Introduction (1).

E N D
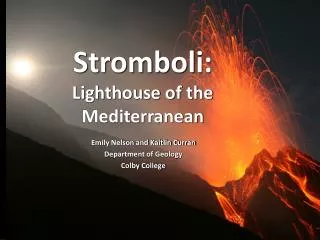
Thelongitude of theMediterraneanalonghistory Luis A. Robles Macías luis.a.robles.macias@gmail.com 24th International Conference on the History of Cartography Moscow, July 2011
Introduction (1) This paper presents the historical evolution of a singular cartographic parameter: the “Longitude of the Mediterranean” in degrees. LongMed Image by Mapsof.net , licensed under CC-BY-SA I will focus on the difference of longitude in degrees, abbreviated LongMed, as opposed to the length of the Mediterranean Sea expressed in units of distance (miles, km…)
Introduction (2) • Why look at this “LongMed” parameter? • Because: • It was displayed with large errors in maps up to 1700 and even later • In such maps the Mediterranean was often less accurate than far-away regions only recently discovered by Europeans • Many of those maps were made by cartographers who lived and worked on the very shores of the Mediterranean • On the other hand, cartographic works with highly accurate values of LongMed have existed since the High Middle Ages I will limit myself to plotting the evolution of the error of the LongMed parameter along time. I will describe general trends and highlight key cartographic works but will otherwise refrain from extracting conclusions from the results. This is a work in progress, your input is most welcome.
Previousstudies of LongMed (1) • Few studies have specifically analyzed the evolution of the error of LongMed along the history of cartography. • A simplistic but rather frequent opinion states that: • Ptolemy made a big error in estimating LongMed due to an underestimation of the radius of the Earth. • This error persisted until the late 17th century. • It was then corrected thanks to astronomic observations. • However medieval tables of coordinates with highly accurate longitudes have been known since the 19th century. • In particular Mercè Comes pointed out that the LongMed is much more accurate in medieval Arabic tables than in Ptolemy’s Geographia but also than in later European cartographic works like Kepler’s Rudolfine Tables. Mercè COMES, “Islamic Geographical Coordinates: al-Andalus’ contribution to the correct measurement of the size of the Mediterranean”, in Science in Islamic Civilization. Studies and Sources on the History of Science (Istanbul: Research Centre for Islamic History, Art and Culture, 2000), 123-138.
Previousstudies of LongMed (2) • Fuat Sezgin did a quite extensive survey of the historical evolution of LongMed: • defined LongMed as the difference of longitude between Tangiers and Iskenderun • focused mainly on printed world maps • attempted to prove that the improvement of LongMed on European maps between 1500 and 1700 was mainly due to earlier Arab-Islamic works • In my opinion, there remains room for improvement in Sezgin’s study: • instead of using two arbitrary locations to define LongMed it is more robust to calculate it as an average of several differences of longitude • several significant cartographic works were omitted by Sezgin, in particular manuscript maps with accurate LongMed well before 1700 • in a few cases I have not been able to reproduce Sezgin’s numeric results Fuat SEZGIN, Mathematical Geography and Cartography in Islam and their Continuation in the Occident, 3 vols., Geschichte des Arabischen Schrifttums (Frankfurt am Main: Institute for the History of Arabic-Islamic Science, 2005)
Methodology: Principles • For this study I have restricted myself to cartographic works that allow measuring longitude unequivocally. • This excludes, among others, medieval portolan charts • I have nevertheless chose to include two maps whose projection is debatable due to their specific interest for this discussion • I have tried to include as diverse cartographic works as possible • nature: manuscript maps, printed maps, globes, tables of coordinates • scope: world, Mediterranean basin, Africa • origin: Greek, Arabic, Hebrew, Italian, Spanish, French, German, Ottoman… • To calculate the “LongMed error” of each cartographic work, I have taken the average of as many measurements as possible.
Methodology: Algorithm • For every cartographic work: • Select Western localities • Select Eastern localities • For each couple of Western and Eastern localities • measure difference of longitudes DLold, • look up actual difference of longitudes DLreal, and • compute relative error ( DLwork – DLreal ) / DLreal • Calculate average error (E) and standard deviation (s) Western localities Eastern localities A W B X C D Y E Z
Methodology: Plottingresults Vertical axis Y represents the error of LongMed Each cartographic work is plotted as a point. Its X value is the date at which it was first created or published. Its Y value is the value of average LongMed error E Vertical error bars represent the standard deviation of LongMed error s Horizontal axis X represents time, in years.
Ptolemy’sGeographia • Claudius Ptolemy’s Geographia contains the earliest known table of coordinates that allows measuring LongMed. • The analysis of these tables is not simple due to several reasons: • lost original • earliest preserved manuscripts from 13th century • two different recensions • large amount of data, 6000 or 8000 localities overall • questioned date, as some place-names post-date Ptolemy (Bagrow 1945) • The numeric study of these tables is today a fruitful field of research: Leif ISAKSEN, “Lines, Damned Lines and Statistics: Unearthing Structure in Ptolemy’s Geographia”, presented at the 6th International Workshop on Digital Approaches in Cartographic Heritage. The Hague, April 2011. Angeliki TSORLINI, Claudius Ptolemy Γεωγραφικήφήγησις(Geographia):Digital analysis, evaluation, processing and mapping the coordinates ofGreece, the Mediterranean and the Black Sea,based on 4 manuscripts and 15 printed editions,from Vaticanus Urbinas Gr. 82 (13th cent.) until today.The new Catalogue “GeoPtolemy- ϑ” PhD dissertation. Aristotle University of Thessaloniki, 2011.
Ptolemy’sGeographia Coastlines inferred from Ptolemy’scoordinatesoverlaid on a modern map. Red line represents the axis Gibraltar – Iskenderun. Image courtesy of Leif Isaksen. I have limited myself to an excerpt of 17 localities from the Geographia’s tables → results to be taken as an order of magnitude only average error E = 45% standard deviation s = 5% Study to be refined based on recently-published research.
Up to 1300 Abu Abdallah Muhammad ibn Musa al-Khwarizmi Kitab surat al-ard (Book of the image of the Earth) Preserved in a copy made in 1037 Substantially more accurate than Ptolemy Same error found later in Toledan tables, Yemenite tables, etc Ishaq ibn al-Hasan al-Zayyat, dead before 1059 Eearliest known independent table of coordinates made in Al-Andalus. 298 entries. Remarkably accurate and internally consistent (i.e. one single meridian of reference for all longitude coordinates). ? Numerous medieval tables show highly accurate and precise LongMed
Al-Zayyat Forf illustration purposes only, I have plotted Al-Zayyat’s coordinates of Western Mediterranean localities over a modern map. Based on data compiled by the late Mercè Comes, kindly provided by Julio Samsó.
Al-Zayyat Idem for the Eastern Mediterranean. Longitude based on Toledo = 18º. Based on data compiled by the late Mercè Comes, kindly provided by Julio Samsó.
Al-Zayyat How did Al-Zayyat manage to ascertain longitudes with a higher accuracy than either Al-Khwarizmi or Ptolemy? Later Andalusian and North African tables are even more accurate and precise than the ones compiled by Al-Zayyat. How were they compiled? A deeper question remains: how much ‘cartography’ is there in these tables, which were often mere appendices of astrological works? In 1923 John K. Wright stated the following, based on his study of the Marseille Tables: “How far was the significance of this sort of information understood? How far was it utilized with a view to giving greater precision to the vague geographical ideas of the time? Reluctantly we must answer: practically not at all. The geographic importance of the figures seems to have been almost entirely overlooked.” In my opinion Wright’s questions are still pertinent but I do not agree with his answer. I think that a clear conclusion is not easy to reach yet.
1300 to 1500 In the 15th century Ptolemy’s Geographia is translated into Latin. As a result numerous European cartographic works start to depict the Mediterranean with a much exaggerated longitude. Circular world map with graticule Contained in the book Masalik al-absar by Ibn Fadlallah al-'Umari (ca. 1340) Abraham Zacut is a late example of highly accurate table of coordinates, albeit with a few gross errors.
1500 to 1550 A highly elongated Mediterranean becomes the norm in European cartography. However, there is not a unique ‘Ptolemaic’ pattern. For example, Oronce Fine chooses in 1531 a shorter Mediterranean than Mercator in 1538. At the same time certain European cartographers draw the Mediterranean accurately. Let’s look at them in detail.
Diego Ribero, 1529 Diego Ribero, of Portuguese origin, had the job of “cosmographer” at the Casa de Contratación of Seville and was therefore responsible for the Padrón Real. Carta universal en que se contiene todo lo que del mundo se ha descubierto fasta agora. Diego Ribero, Seville, 1529. Facsimile images courtesy of the Library of Congress.
Diego Ribero, 1529 • The map does not contain a full grid of coordinates but in my opinion it is quite likely based on a plate-carréeprojection, as it contains five horizontal parallels ; three vertical meridians ; graduated equator and graduated meridian • Assuming a plate-carréeprojectionthe error of LongMedisremarkablysmall: • E = -1.3% s = 1.7% • Highlyaccurate latitudes too. Doesnot show the usual rotation of portolan charts.
Diego Ribero, 1529 In a text box on the map, Ribero explains that he took latitude data both from direct astronomical observations and from previous reports by other geographers. He does not mention any source of longitude values however. He is nevertheless aware that his map contains a substantial inconsistency in terms of longitude. He says that he preferred to exaggerate grossly the width of the Middle East rather than to deform the Mediterranean “from what is already used and conceived in the mind.”What did he mean?
Jean Rotz, 1542 World map in two hemispheres in stereographic projection. Part of a manuscript atlas entitled Boke of Idrography made by this cartographer and navigator from Dieppe (France) around 1542. Today preserved at the British Library. Complete and precise graticule allows unequivocal measurement of LongMed. It turns out to be quite accurate: E = 10% s = 6% Which were Jean Rotz’s sources?
Battista Agnese, 1536 Two maps showing different values of LongMed coexist in a same cartographic work: the manuscript atlases drawn by Battista Agnese from 1536 to 1564. Pages 25-26 of the atlas Oval world map with ‘ptolemaic’ Mediterranean Complete graticule allows unequivocal measurement of LongMed: E = 53% s = 6% Image courtesy of the Library of Congress.
BattistaAgnese, 1536 • Pages 9 – 10 of the atlas • ‘Nautical chart’ style map • Possibly in plate-carrée projection but not certain: • horizontal equator and Tropics • one vertical meridian • graduated equator and meridian • Assuming a plate-carrée, LongMed would be very accurate: • E = - 3% s = 4% Image courtesy of the Library of Congress.
Battista Agnese, 1536 Oval world map E = 53% s = 6% ‘Nautical chart’ style map Plate-carrée projection (assumed) E = - 3% s = 4% Why?
1550 to 1600 Myritius Since 1560 numerous maps begin to show LongMed with E around 30%. Abraham Ortelius and Rumold Mercator adopt this value and make it the de facto standard of LongMed for the following decades. In the second half of the 16th century the confusion about the longitude of the Mediterranean reaches its zenith. Numerous maps follow the Ptolemaic tradition (E ca. 40%) At the same time, the Iberian school keeps on representing the Mediterranean correctly (D. Homem 1558, E = -7%) The Dieppe school also keeps on showing a slightly too big LongMed (J. Cossin 1570, E = 16%)
1600 to 1700 Along the 17th century diversity remains. In 1627 Johan Kepler, the famous astronomer, publishes a famous table of coordinates that shows a Mediterranean around 25% too long. Nevertheless values of error around 30% or above are not rare in maps from the second half of the 17th century. Printed maps with accurate values of LongMed start to appear in the 1650’s. This trend becomes dominant towards the end of the century.
Summing up 65 cartographic works surveyed to date. The evolution of LongMed error turns out to be quite complex. Cartographic works with significantly different accuracies coexist in the same time frame and same location. Beware of simplistic explanations. This study is a work in progress. Your input is most welcome!
Acknowledgements • In memoriam Mercè Comes • I would like to thank the following individuals and institutions: • Julio Samsó for providing access to Mercè Comes’s unpublished data and for his kind and helpful advice • Jean-Charles Ducène for providing access to his soon-to-be-published work on the Yemenite tables • The Germanische Nationalmuseum and TU Wien for providing projected images of Martin Behaim’s globe • Leif Isaksen for his advice on Ptolemy’s Geographia • And of course thank YOU for having watched this automatic presentation!
Thelongitude of theMediterraneanalonghistory Luis A. Robles Macías luis.a.robles.macias@gmail.com 24th International Conference on the History of Cartography Moscow, July 2011