Download
1 / 19
190 likes | 305 Views
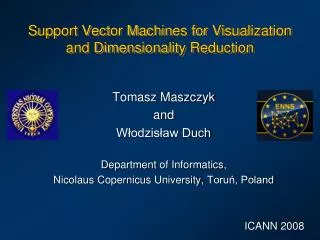
Support Vector Machines for Visualization and Dimensionality Reduction. Tomasz Maszczyk and Włodzisław Duch D epartment of Informatics , Nicolaus Copernicus University , Toruń, Poland ICANN 2008. Plan. Main idea.

E N D
SupportVectorMachines for Visualization and DimensionalityReduction Tomasz Maszczyk and Włodzisław Duch Department of Informatics, Nicolaus CopernicusUniversity, Toruń, Poland ICANN 2008
Plan • Mainidea. • Short description of three popular methods frequently used for visualization : • Multidimensional Scaling (MDS) • Principal Component Analysis (PCA) • Fisher Discriminant Analysis (FDA) • Description of our approach. • Results on artificial and real data.
Main idea • Many classifiers work as black-box predictors. • Quality estimated on accuracy or cost measures. • It's important to be able to evaluate a specific case, showing the confidence in predictions in the region of space close to this case. • PCA, ICA, MDS and other commonly used for direct visualization useful for exploratory data analysis, but do not provide information about reliability of the method. • We shows how to use any LDA or SVM classifier in its linear or kernelized version for dimensionality reduction and data visualization.
Multidimensional Scaling (MDS) • Non-linear technique of visualization . • Decreases dimensionality preserving original distances in high-dimensional space. • Need only similarities between objects, so explicit vector representation of objects is not necessary. • In metric scaling uses quantitative evaluation of similarity using numerical functions. • For non-metric scaling uses qualitative information about the pairwise similarities. • Differ by their cost functions, optimization algorithms, the number of similarity matrices used and the use of feature weighting.
Multidimensional Scaling (MDS) • The most commonly used stress function: dij - distances in the target space Dij - distances in the input space, calculated using some metric functions • These measures are minimized over positions of all target points. • Cost functions are not easy to minimize, with multiple local minima representing different mappings. • Initial configuration is either selected randomly or based on projection of data to the space spanned by principal components. • Orientation of axes is arbitrary, and the values of coordinates do not have any simple interpretation (only relative distances are important).
Principal Component Analysis (PCA) • Linear projection method. • Finds orthogonal combinations of input features accounting for most variation in the data. • Principal components guarantee minimal loss of information when position are recreated from their low-dimensional projections. • Projecting the data into the space defined by 1-3 principal components provides for each input vector its representative in the target space. • For some data distributions such projections show informative structures.
Fisher Discriminant Analysis (FDA) • Supervised methods find projections that separate data from different classes in a better way. • It maximizes the ratio of between-class to within-class scatter, seeking a direction W such that: where the scatter matrices SB and SI are defined by: where mi and are the sample means and covariance matrices ofeach class and m is the sample mean. • In our implementation pseudoinverse matrix has been used to generate higher FDA directions.
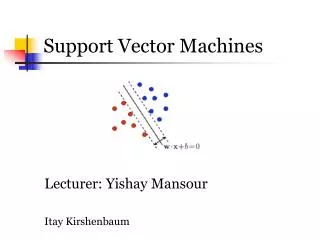
Linear SVM • Search a hyperplane that provides a large margin of classification, using regularization term and quadratic programming. • Non-linear versions are based on a kernel trick that implicitly maps data vectors to a high-dimensional feature space where the best separating hyperplane is constructed. • Linear discriminant function is defined by: • The best discriminating hyperplane should maximize the distance between decision hyperplane and the vectors that are nearest to it. • Vector W, orthogonal to the discriminanthyperplane, defines direction on which data vectors are projected, and thus may be used for one-dimensional projections.
Linear SVM • The same may be done using non-linear SVM based on kernel discriminant: • The x=gW(X) values for different classes may be smoothed and displayed as a histogram, estimating either the class-conditionals or posterior probabilities. • The first projection should give gW1(X)<0 for vectors from the first class and >0 for the second class. • The second best direction may be obtained by repeating SVM calculations in the space orthogonalized to the already obtained W directions.
Linear SVM • This process may be repeated to obtain more dimensions. • Each additional dimension should help to decrease errors estimated by CV. • Optimal dimensionality is obtained when new dimensions stop decreasing the number of errors in CV tests. • In case of non-linear kernel gw(X) provides the first direction, while the second may be generated e.g. repeating training on subset of vectors that are close to the hyperplane in the extended space using some other kernel.
Four datasets • Parity_8:8-bit paritydataset (8 binaryfeatures and 256 vectors). • Heart:diseasedatasetconsist of 270 samples, eachdescribed by 13 attributes, 150 casesbelongs to group „absence” and 120 to „presence of heartdisease”. • Wisconsin:breastcancer data contains 699 samples collectedfrompatients. Amongthem, 458 biopsiesarefrompatientslabeled as „benign”, and 241 arelabeled as „malignant”. Feature 6 has 16 missingvalues, removingcorrespondingvectorsleaves 683 examples. • Leukemia:microarraygeneexpressions for twotypes of leukemia (ALL and AML, with a total of 47 ALL and 25 AML samplesmeasuredwith 7129 probes.Visualizationisbased on 100 bestfeaturesfromsimplefeature ranking using FDA index.
Estimation of class-conditional probability in the first SVM direction
Summary • Visualization enables exploratory data analysis, gives more information than accuracy or probability. • Helps to understand what black box classifiers really do. • When safety is important, visualization methods may evaluate confidence in predictors. • Sequential dimensionality reduction based on SVM has several advantages: • enables visualization • guarantees dimensionality reduction without loss of accuracy • increases accuracy of the linear discrimination model • very fast • preserves simple interpretation
Summarycont. • SVM decision borders can be visualized using estimations of class-dependent or posterior probabilities. • Visualization help evaluate the reliability of predictions for individual cases, showing them in context of the known cases. • We plan to add visualization of probabilities and scatterograms to a few popular SVM packages soon.