Download
1 / 45
450 likes | 634 Views
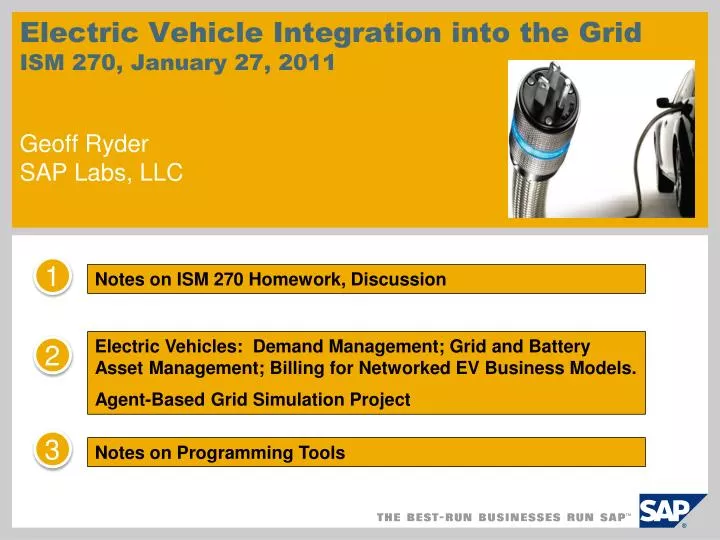
Electric Vehicle Integration into the Grid ISM 270, January 27 , 2011 Geoff Ryder SAP Labs, LLC. 1. Notes on ISM 270 Homework, Discussion. Electric Vehicles: Demand Management; Grid and Battery Asset Management; Billing for Networked EV Business Models.

E N D
Electric Vehicle Integration into the GridISM 270, January 27, 2011Geoff Ryder SAP Labs, LLC 1 • Notes on ISM 270 Homework, Discussion • Electric Vehicles: Demand Management; Grid and Battery Asset Management; Billing for Networked EV Business Models. • Agent-Based Grid Simulation Project 2 3 • Notes on Programming Tools
Safe Harbor Statement This document is intended to outline future product direction, and is not a commitment by SAP to deliver any given code or functionality. Any statements contained in this document that are not historical facts are forward-looking statements. SAP undertakes no obligation to publicly update or revise any forward-looking statements. All forward-looking statements are subject to various risks and uncertainties that could cause actual results to differ materially from expectations. The timing or release of any product described in this document remains at the sole discretion of SAP. This document is for informational purposes and may not be incorporated into a contract. Readers are cautioned not to place undue reliance on these forward-looking statements, and they should not be relied upon in making purchasing decisions.
Estimate: California statewide cumulative investment through 2020 to achieve RPS goals
Suppliers & Partners Generation Transmission & Distribution Meter Operation Retail & Services Customers & Channels Asset Life Cycle Management Supply Operations Resource Management Meter Reading Services Energy Capital Management Selling of Energy and Services Customer Service Management Billing of Energy and Services Customer Financial Management Collaborative Services & Intercompany Data Exchange Enterprise Management & Support Analytics Strategic Enterprise Management Financial Analytics Operations Analytics Workforce Analytics Financials Financial Supply Chain Management Financial Accounting Management Accounting Corporate Governance Human Capital Management Talent Management Workforce Process Management Workforce Deployment Corporate Services Travel Management Environment, Health and Safety Incentive and Commission Management Real Estate Management Operations Support Life-Cycle Data Management Project and Portfolio Management Quality Management Indirect Procurement Global Trade Services SAP’s Utilities Solution Map
Estimate: California statewide cumulative investment through 2020 to achieve RPS goals
Delivering the Business CaseSustainability is an IT integration challenge Sustainability Strategy Sustainability Strategy OperationalRisk Mgt On Device • SustainabilityReporting • BusinessObjects Explorer • EHS Analytics Orchestration MIIManufacturingIntegration Resource Productivity Sustainability Strategy OperationalRisk Mgt Sustainable Consumption Sustainable Consumption Raj Valame, energy management for manufacturing On Demand+ Add-on AMI Integrationfor Utilities • SustainabilityPerformance Mgt • EHS Mgt CarbonImpact • Global BatchMgt • ReachCompliance Resource Productivity Resource Productivity Resource Productivity Sustainable Consumption Sustainable Consumption On Premise Resource Productivity • SupplyChain Mgt • Transpor-tation Mgt • SupplierRelationship Mgt • RecyclingAdministration
Palo Alto Energy Efficiency Showcase:$2M Investment in Clean Tech http://www.cnbc.com/id/15840232/?video=1707896067&play=1 Dec. 9, 2010 All Projects Tele-presence LED, Light Controls Solar PV Panels EVs and Chargers COIL DC Conversion
Video: Better Place Battery Swapping Operation, Timed Here are links that describe our EV-related deployments at SAP Palo Alto: http://www.cnbc.com/id/15840232/?video=1707896067&play=1 http://www.youtube.com/watch?v=csV1W75hhZ0
Electric Vehicles: Compare costs per mile Approximation: 1 kWh = 4 miles of driving distance Nissan Leaf: approx. 25 kWh battery pack = 100 miles before recharging Case: my Nissan Maxima, 20 mpg, 15 gallon gas tank, $3 per gallon One fill-up is $45, and I can travel 300 miles. Cost per mile is $45 / 300 = $0.15 per mile Case: a new Nissan Leaf. Electricity costs $0.1 per kWh. One fill-up is $0.1 * 25 = $2.50, and I can travel 100 miles. Cost per mile is $2.50 / 100 = $0.025 per mile!
Charging Station Capacity Home charging unit Say your EV has a 25 kWh battery pack. To charge it all the way from zero: Level 1 Charger: 120 V AC, 14 A = 15 hours to charge Level 2 Charger: 240 V AC, 14 A = 7.5 hours Level 3 Charger (not available for most homes): 480 V DC, 125 A = 42 minutes
Roll-out Schedule for Plug-in Electric Vehicles BEV PHEV Saturn VUE BYD in Europe Chevrolet Volt Fisker Karma Kia LPG/Electric EPRI, Eaton, Ford Trouble Truck Subaru Stella Chrysler Nissan LEAF Smart for Two 2009 2010 2011 2012 BMW Mini E ZENN City BYD EV in China Mitsubishi iMiEV Toyota Prius Ford Escape Hyundai Tesla Roadster Aptera BYD F3DM Tesla Roadster Nissan Leaf PriusPHEV Hyundai i10
New Electric Vehicles from China Shandong Baoya Vehicle Co.: the Baoya Electric Car 150 km per charge Beijing Automotive Industry Holding Co. BE701 200 km per charge Changan Automotive Group (Ford partner) BenBen electric conversion (Canada) Haifei Auto Group: Saibao, 160 km per charge
$ Revenue Impact of EVs Electric Power Utilities Automobile OEMs EV-Driven Electricity Sales ICE Car Sales and Service New Capital Investments EV Sales and Service New Distribution-Level Infrastructure, Programs for EV Owners Current US Vehicle Fleet: ~ 246M US EV Sales, 2015: ~ 1M?
Utility Electric Vehicles:It’s All About the Battery Internal Combustion Engine (ICE) Vehicle Car Manufacturer OEM Gas station Weak relationships after purchase Electric Power Utility OEM --Set up home charging station --Billing relationship for fuel --Demand management, load shaping --Grid asset management --Needs OEM-authorized service --OEM responsible for battery asset management
Utility Utility Utility Large-Scale EV Infrastructure Business Models Turnkey(e.g. BetterPlace) Utility Centric (e.g. RWE) Charge Station Centric (e.g. Coulomb Tech) Car Manufacturer Car Manufacturer Car Manufacturer Power supply & Billing Demand mgmt Demand mgmt Demand mgmt Power supply & Billing (opt.) Power supply • Public and privatecharging stations by multiple operators • Electricitydistributor • Charge stations • Billing • Electricity Distributor • Own battery &charge station Subscribe $/ mile Pay utility bill Pay to charge Battery rental Pay utility bill Charge Sell car w/ battery(or lease) Sell car w/o battery Sell car w/ battery (or lease)
Video: Better Place Battery Swapping Operation, Timed URL: Better Place battery swapping demo, Yokohama
Utility 1 • Demand Management Internal Combustion Engine (ICE) Vehicle Car Manufacturer OEM Gas station Weak relationships after purchase Electric Power Utility OEM --Set up home charging station --Billing relationship for fuel --Demand management, load shaping --Grid asset management --Needs OEM-authorized service --OEM responsible for battery asset management
The Impact of Electric Vehicle Charging on the Grid • Problem: can older poletop transformers in our service territory handle the new load? • (Research by ArindamMaitra, EPRI, 2010)
Asset Capacity versus EV Penetration Level(Research by ArindamMaitra, EPRI, 2010)
Solution: Manage EV Charging Demand through Time of Use Pricing (TOU) MW MW Shift demand Hour of day Hour of day
Example of a Time of Use Pricing Schedule(PG&E Team, PlugIn San Jose, 2010)
SAP and its partners enable utility-centric EV charging Utility Bill Billing The charging station is a sub-meter to the smart meter. The AMI channel for the station is mapped to a device in the SAP billing system. …through AMI, bypassing the smart meter, but using the same protocol. …using a proprietary protocol to the network operation center of the charging station operator, and from there directly submitting data to MDUS. …directly from the charging station operator to SAP billing software. 1 MDUS 3 AMI 2 2 Charging Station Operator 4 4 4 Business or Residence Building Power Control Unit Electric Vehicle Charging Station 3 Smart Meter: 1 Other electricity loads
Utility-centric EVSE deployments are taking place in the midst of the rollout of the smart grid.Role of eMobility companies in the smart grid ecosystem: Distributed generation and storage Networked vehicles Grid optimization Demand response Smart meter services Communication layer: HW, SW, Control Image credit: GTM Research. Downloaded 10/13/2010 http://www.greentechmedia.com/images/wysiwyg/research-blogs/taxonomy-large.jpg
EV Owners Get TOU Pricing Signals through Vehicle Telematics Apps Announced at CES, 2011 Ford Focus Electric, due out in late 2011 With Microsoft, Inc.: MyFord Mobile Software automatically charges the vehicle during off-peak hours, when utility rates are cheapest. Credits: Detroit Edison, Inc. Automatiks, Inc. Telematics Detroit Conference, 2010
Utility 2 • Battery and Grid Asset Management Internal Combustion Engine (ICE) Vehicle Car Manufacturer OEM Gas station Weak relationships after purchase Electric Power Utility OEM --Set up home charging station --Billing relationship for fuel --Demand management, load shaping --Grid asset management --Needs OEM-authorized service --OEM responsible for battery asset management
P P S S S O O 2601a Bryant St 2601b Bryant St T P 2635 Bryant St S S S P 2645 Bryant St E 2650 Bryant St File View Help Tools E 2660 Bryant St E 2665 Bryant St E 2675 Bryant St Block view 3:21PM Bryant St / 24th – 25th San Francisco, CA 94110 Electric Vehicle Management Transformer Public Charging Station2601a Bryant St Model: ABC 45c Year: 2009 Last maintenance: 9/12/09 Next maintenance: 10/19/10 Usage profile Charging Stations
Utilities Service providers Service providers Asset management of electrified vehicle infrastructure • There will be a multitude of ownership and lease models for charging stations with the installation and maintenance typically sub-contracted to local service providers Charging StationOperators Extensions to SAP AssetManagement Vehicle Manufacturer On-demand Asset Management Hub Home Office Public - City Public - Corporate Other
Utility 3 • Billing for Networked EV Business Models Internal Combustion Engine (ICE) Vehicle Car Manufacturer OEM Gas station Weak relationships after purchase Electric Power Utility OEM --Set up home charging station --Billing relationship for fuel --Demand management, load shaping --Grid asset management --Needs OEM-authorized service --OEM responsible for battery asset management
PG&E PG&E Billing and pricing need to accommodate heterogonous technologies and business models Utility Supplier ChargingNetworkOperator Charge Location / Operator Office Home Charge Station Daily daytime recharge Nightly recharge Ad-hoc recharge ID ID ID End User Customer relationship Battery charging Billing relationship
CeBIT demo, March, 2010: SAP Enables Consolidated Billing for eMobility Utility company #2: a separate utility that owns the charging station Utility company #1: the EV driver’s home utility SAP server, Palo Alto, CA Webtech server, Canada Coulomb server, Campbell, CA Equipment at the CeBIT conference floor: the networked console of an EV, from Webtech, and a networked charging station, from Coulomb
Utility Company Business Models:Predicted EV-Related Revenue Streams Source: Frost and Sullivan
Simple ROI for one charging station, for a small business. One networked pedestal-mount EVSE costs $4K. +5 +4 +2 +3 +1 Year +6 1K dollars • With no public subsidy, the charging station must generate ~$1000 per year in revenue or more for the investment to have a positive net present value (NPV). With public subsidy for 50% of total cost ~$500 per year • Options for revenue: • (1) Reselling utility company electricity revenue sharing agreement with EVSE network operator and utility • (2) Charging more to park by the EVSE (priority classes, fleet discounts?) • (3) Additional sales volume from higher customer traffic or longer customer stays • (4) Providing other services for, e.g., municipal government • (5) Claiming “low-carbon fuel credits” for electricity sold • (6) Other types of revenue sharing with EVSE network operator
Pricing structures for electrical fuel, considering models from the utility, telecom, airline and oil & gas industries Billing Telecom Gas Stations Fleet Tradi-tionalUtilities Pre-Pay Open for discus-sion CreditDebit Airline PricingAirlines are another industry with sophisticated pricing models and a service/product with similar characteristics to electricity. Overbooking flights is an particular interesting strategy for maximizing utilization of capacity. Cash Tiered Rate Price based on volume per period, e.g. 10c for the first 10 kWh, 15c for 10kWh – 20 kWh • Time-of-usePrice based on time of use, e.g. 10c for off-peak/ nights & weekends, 25c for peak / daytime Flat Rate Unlimited use of service, e.g. unlimited text messages or nation-wide calls Servicelevelprice based on service level agreement, e.g. $29.99 for 512kB upload / 6 Mb download speed Real-timemarket-based prices, e.g. gasoline prices related to oil prices
SAP’s Sybase mcommerce solutions: SingTel MobilePay Insert subhead here as a full sentence at 18 point font, bold
Examples of vehicle telematics: differentiated service offerings for EV drivers Factors influencing prices • Regulations on EVSE ownership, use, business models • Contracts by type of use: • Commuter • Recreation • Postal service • Small business delivery • Private or public buses • Service trucks (e.g., utilities) • Public services (e.g. police) • Taxis • Type of communications, and intermediaries • SMS message • display screen in the car • smart phone
Standards for EV Communication: Security? Privacy? EVCP Protocol Stack Business and Technology Issues Application-Level Protocol • Authentication / Security / Privacy • X.509 certificates (certificate authority, when issued and by whom) • Security on both sides of transaction • Privacy equivalent to existing fueling models (e.g. cash / credit / debit payment at gas station) • Identity data • VIN number • (universal) utility ID • ... • Protocol Categories • Billing protocol • Vehicle battery charging protocol • Vehicle sensor data protocol • Vehicle services delivery protocol (e.g. POS services) • Vehicle diagnostics information protocol • Protocol Uniformity • Same protocols for all charging infrastructure (residential, standalone, private, workplace, etc.) ? XML HTTP, HTTPS TCP/IP WiMAX ® Cellular (GPRS,EDGE ®) Bluetooth ® 2.0, 3.0 WiFi ® Zigbee ® Other wireless standards Hard-wired interface
Trading LCFS credits will generate additional revenues.It requires separate accounting of electricity used for transportation LCFS credits for $$$ LCFS Markets It is still under debate which entity can claim the revenues generated from LCFS credits, candidates include utilities, vehicle manufacturers, and car owners Implications for AMI and Accounting Solutions • Metering of transportation used electricity, e.g. sub-metering • Dual data record management through complete AMI infrastructure • Metering and accounting of non-residential, transportation-used electricity • Create account for transportation-used electricity, link to trading sub-system and financial accounting system (after LCFS are being sold) Sub-Meter (transportation use) Smart Meter (residential use)
Conclusions, Next Steps Contact: geoff.ryder@sap.com 1 • EV Demand Management • Time of Use Pricing, through AMI and Vehicle Telematics. • Call for innovation: driver communications, demand response... 2 • Grid and Battery Asset Management • Through existing asset management platforms. • Call for innovation: security, privacy of EV drivers’ personal information... 3 • Billing for Networked EV Business Models • Time of Use Pricing, through AMI and Vehicle Telematics. • Call for innovation: new networked business models + revenue streams to make infrastructure deployment more profitable, and to lower costs...