Download

1 / 9
90 likes | 221 Views
Osmosis Lab. Jordan Smith Lisa Muchmore Carly Taylor Ciera Lund. Background.

E N D
Osmosis Lab Jordan Smith Lisa Muchmore Carly Taylor Ciera Lund
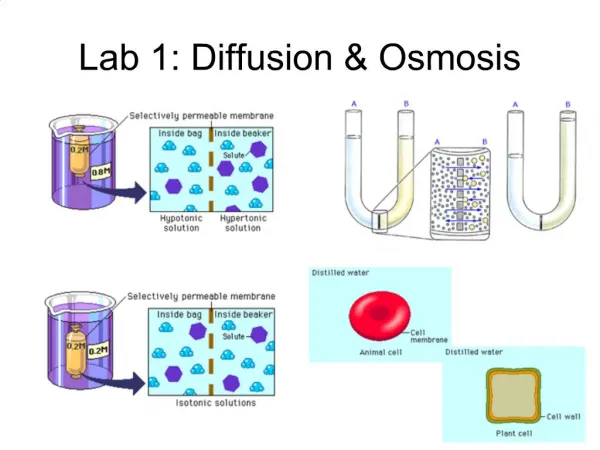
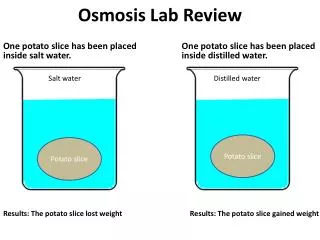
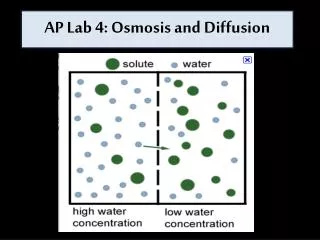
Background • In plants and animals liquid pressure is maintained by osmosis. The small molecules such as water and salt pass through the semi-permeable membrane of these plants or animals to try and maintain balance or dilute the surrounding liquid this raises the osmotic pressure.
The purpose of this lab was to see how size affected osmotic rate. Purpose
Hypothesis • Our hypothesis was….that the smaller the object, the more it will be affected.
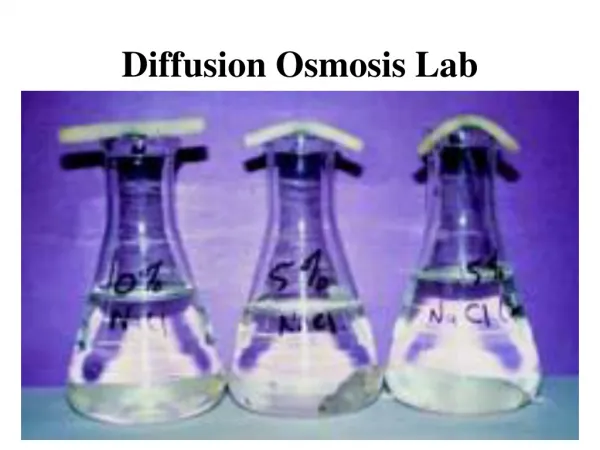
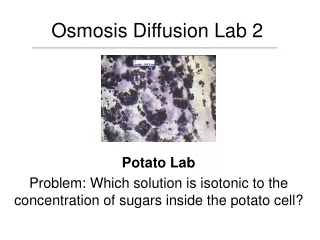
Procedure • Step one: Get 5 different sized pieces of potatoes.(1,3,5,7,9)Step two: Weigh all 5 potato pieces and recordStep three: Make a mixture with 100 mL of distilled water with 3% salt. And mix till salt dissolvesStep four: Get 5 cups and in each place one of the potatoes. Add 20 mL of the distilled water and salt mixture. Step five: Let potatoes sit in there mixture for 30 minsStep six: After 30 mins take all potatoes out of there cups. Dry them off and then weigh them.
Data Potatoes Before Exposure to Salt Water: Diameter Grams 9mm - - - - - - - -9g 7mm - - - - - - - -6g 5mm - - - - - - - -3.5g 3mm - - - - - - - -2.5g 1mm - - - - - - - -.75g Potatoes After Exposure to Salt Water: Diameter Grams 9mm - - - - - - - 8g 7mm - - - - - - - 5g 5mm - - - - - - - 3g 3mm - - - - - - - 1.2g 1mm - - - - - - - .5g
Percent Mass Change 9mm = - 12.5% 7mm = - 20.0% 5mm = - 16.7% 3mm = - 108.0% 1mm = - 50.0%
Conclusion After conducting our experiment we came to the conclusion that size doesn’t really affect osmotic rate. Each piece of potato lost a small amount of weight after sitting in a 3% salt and water solution for 30 minutes. Our hypothesis was the smaller the object the more it will be affected. Our results did not agree with this statement because each different diameter lost around .5 to 1g of weight. No drastic changes were shown in the data. Throughout this experiment something that could have gone wrong was the amount of salt we put in the water solution could have not been exactly 3g which might have thrown off the amount of weight each potato lost. Next time if we were to do this experiment again we would try to make each measurement and weight as exact as we can when getting all the materials together so that the results could be more reliable. This means that the potato was in hypertonic environment. This means that the salt concentration was greater in the water than in the actual potato. Also this made the H20 flow out of the potato causing weight loss.