Download

1 / 26
260 likes | 399 Views
Density. What is it and how do we use it?. Density. Density is a ratio that compares the mass of an object to its volume. Density can be found using the formula: Density = Mass Volume. Problems.

E N D
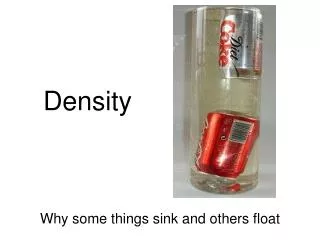
Density What is it and how do we use it?
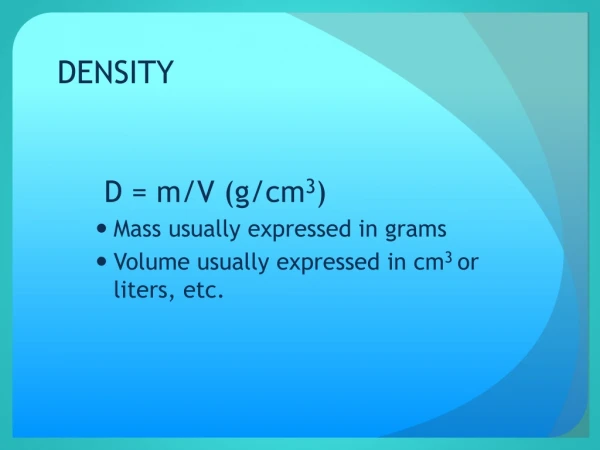
Density • Density is a ratio that compares the mass of an object to its volume. • Density can be found using the formula: Density = Mass Volume
Problems • A piece of metal with a mass of 147 g is placed in a 50-mL graduated cylinder. The water level rises from 20 mL to 41 mL. What is the density of the metal? • What is the volume of a sample that has a mass of 20 g and a density of 4 g/mL? • A metal cube has a mass of 20 g and a volume of 5 cm³. Is the cube made of pure aluminum? Explain your answer.
Answers • 7.0 g/mL • 5 mL • No; the density of aluminum is 2.7 g/cm³; the density of the cube is 4 g/cm³.
Temperature What scale to use?
Measuring Temperature • A thermometer is an instrument that measures temperature, or how hot an object is. • The two temperature scales that you are probably most familiar with are the Fahrenheit scale and the Celsius scale • You can convert from one scale to the other by using one of the following formulas.
The Kelvin Scale • The kelvin is the SI unit of temperature. • On the Kelvin scale, water freezes ar about 273 K and boils at 373 K. • It is easy to convert from celsius to kelvin. Kelvin = °C + 273 • No degree sign is needed with kelvin.
Operations with Scientific Notation Adding and Subtracting Multiplying and Dividing
Adding and Subtracting • Exponents must be the same or the operation cannot be performed. If the exponents do not agree, change the decimal and the power of ten notation of either number so as to agree with the other. • Add or subtract the number. • Keep the same power of ten.
Multiplying and Dividing • MULTIPLICATION: • Multiply the numbers. • Add the exponents for the power of ten. • DIVISION: • Divide the numbers as in any division problem. • Subtract the denominator power of ten exponent from the numerator power of ten exponent.
Percent Error How much uncertainty?
Percent Error • Percent error is used to calculate the accuracy of experimental data values and the accepted value. • Percent error is the ratio of an error to its accepted value and can be found using the following formula: Percent error = error . X 100 accepted value
Significant Figures What are they?
Significant figures • Scientists indicate the precision of a measurement by the number of digits they report. • 3.52 g is more precise than 3.5 g. • The digits they report are called significant figures. • Significant figures include all known digits plus one estimated digit.
Rules for Significant Figures • All non-zero numbers are always significant. • Zeros between non-zero numbers are always significant. • All final zeros to the right of the decimal place are significant. • Zeros that act as placeholders are not significant. Convert quantities to scientific notation to remove the placeholder zeros. • Counting numbers and defined constants have an infinite number of significant figures.
Rounding When do you round and how?
Rounding • A calculated value with eight significant figures is not appropriate when you only need four significant figures.
Rules for Rounding • If the digit to the immediate right the last significant figure is less than five, do not change the last significant figure. • If the digit to the immediate right of the last significant figure is greater than five, round up the last significant figure. • If the digit to the immediate right of the last significant figure is equal to five and is followed by a nonzero digit, round up the last significant figure. • If the digit to the immediate right of the last significant figure is equal to five and is not followed by a nonzero digit, look at the last significant figure. If it is an odd digit, round it up. If it is an even digit, do not round up.
Presenting Scientific Data
Organizing Data • Scientists accumulate vast amounts of data by observing events and making measurements. • Interpreting these data can be a difficult task if they are not organized. • Scientists can organize their data by using data tables and graphs. • These tools make it easier to spot patterns or trends in the data that can support or disprove a hypothesis
Data Tables • The simplest way to organize data is to present them in a table. • The table relates two variables—an independent variable and a dependent variable.
Line Graphs • A line graph is useful for showing changes that occur in related variables. • In a line graph, the independent variable is generally plotted on the horizontal axis, or x-axis. • The dependent variable is plotted on the vertical axis, or y-axis, of the graph. • A direct proportion is a relationship in which the ratio of two variables is constant. • An inverse proportion, a relationship in which the product of two variables is a constant.
Bar Graphs • A bar graph is often used to compare a set of measurements, amounts, or changes. • The bar graph makes it easy to see how the data for one thing compares with the data for another.
Circle Graphs • A circle graph is a divided circle that shows how a part or share of something relates to the whole.
Communicating Data • A crucial part of any scientific investigation is reporting the results. • Scientists can communicate results by writing in scientific journals or speaking at conferences. • Scientists also exchange information through conversations, e-mails, and Web sites. • Young scientists often present their research at science fairs
Peer Review • Different scientists may interpret the same data differently. This important notion is the basis for peer review, a process in which scientists examine other scientists' work. • Peer review encourages comments, suggestions, questions, and criticism from other scientists. • Peer review can also help determine if data were reported accurately and honestly.