Download

1 / 25
250 likes | 260 Views
The Nature of Science. Experimental Investigations. Making Observations. To make a Data Table : QUANTITATIVE observations. Give your table a TITLE. Observations of Bubble Tubes. Label the type of observation. Make room for recording your DATA. Making Observations.

E N D
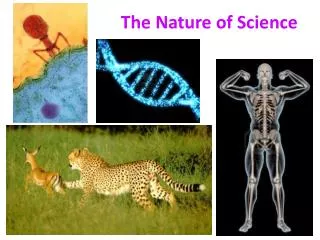
The Nature of Science Experimental Investigations
Making Observations To make a Data Table: QUANTITATIVE observations Give your table a TITLE Observations of Bubble Tubes Label the type of observation Make room for recording your DATA
Making Observations To make a Data Chart: QUALITATIVE observations Give your chart a TITLE Observations of Bubble Tubes Label the type of observation Make room for recording your DATA
Facts, Opinions, Inferences • Fact • Is true for everyone • Opinion • Personal belief that is not founded on proof • Inference • Conclusion based on observation
The Pre-experiment Stage Asking Questions Developing Hypotheses
Bubble Tube Questions • Does the color of the liquid make a difference in how fast the bubble moves? • Does the angle of the tube make a difference in how fast the bubble moves? • ?????????
Using Effect & Affect • Does the color of the liquid affect the speed of the bubble? • What is the effect of the color of the liquid on the speed of the bubble? • Does the angle of the tube affect the speed of the bubble? • What is the effect of the angle of the tube on the speed of the bubble?
Hypothesis • If the angle of the tubeincreases, then the speed of the bubble will increase. • If the angle of the tubedecreases, thenspeed of the bubble will increase.
Experimental Stage Designing an Experiment Collecting Data
Designing an Experiment • Identify variables • Independent / manipulated : • Angle of tube • ????? • Dependent / responding: • Speed of bubble • Controlled / constants: • Person timing • Person handling tube • ?????
The Design • What was being changed? • How was it being changed? • What was being measured? • How was it being measured? • How many trials were done?
Making a Data Table Label your specific independent variables Give your table a TITLE The effect of angle on the speed of a bubble Make room for recording the dependent variable
Data Collection IV 1 – color of tube Title IV 2 – Angle of the tube Place to record data or dependent variabls Place to record data or dependent variable
Post Experimental Stage Data Analysis Drawing Conclusions
The Question –Does the angle of the tube affect the time it takes the bubble to move from one end of the tube to another? • TWO independent variables • ANGLE of tube • COLOR of liquid in tube • ONE dependent variable • Time or speed • Controlled variables • Same timer, same ‘flipper’
Data Analysis • Reduce the data • Measures of central tendency • Mean • Median • Mode • Range • Frequency
Graphing the Reduced Data • Line graphs show us change or trends • Why was a line graph an appropriate graph for our data?
Graphing Data Include a descriptive title The effect of ……. Use appropriate scale and interval Include all independent / manipulated variables and label Time of travel (sec) Show dependent / responding variable and unit of measurement Angle 1 Angle 2 Angle 3 Angle of tube
Look for Relationships • Variables are related if one of them changes when the other changes. • If a change in one variable affects the other variable, then the two variables are related to one another. • Direct relationship • Change in the same direction • Indirect relationship • Change in opposite directions
Data Analysis • Look patterns of change • As angles decrease, what happens to the time? • Is this true for all angles? • As angles increase, what happens to the time? • Is this true for all angles? • What kind of comparison can you make with the colors of the tubes?
Drawing Conclusions • Data will support or not support your hypothesis • Hypothesis is rejected or accepted • Never ‘right’ or ‘wrong’ • Answer the original question • Use evidence (data) to back up what you say
Elaborating, Expanding, Applying • Sources of error • What else could be done?