Download
1 / 23
360 likes | 1.27k Views
Financial Risk Management Framework - Cash Flow at Risk. 2. Annual Conference of the Croatian Association of Corporate Treasurers. September 2005. Presentation Outline. Financial Risk Management Framework Risk Measures Value at Risk. Cash Flow at Risk.

E N D
Financial Risk Management Framework- Cash Flow at Risk 2. Annual Conference of the Croatian Association of Corporate Treasurers September 2005
Presentation Outline • Financial Risk Management Framework • Risk Measures • Value at Risk. • Cash Flow at Risk. • at-Risk Engine – concept and implementation • Form of advisory support
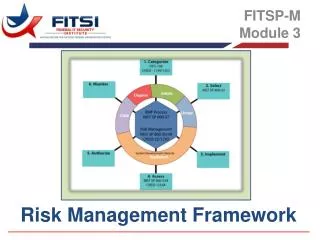
Financial Risk Management Framework The risk management framework in a corporate organization consists of the following components: • Financial Risk Management Strategies • Financial Risk Management Policies • Financial Risk Management Methodologies The risk management framework should be closely linked to the accounting (proper treatment of hedges under IAS 39). The topic of the presentation is one particular methodology for measuring market risk.
Risks in Non-financial Companies • Treasury survey which Ernst & Young conducted this year in the Czech republic in cooperation with the Czech association of treasury revealed that the most important risk for non-financial companies is the liquidity risk. • The second in terms of significance is the FX risk. 97 % of the surveyed companies are exposed to FX risks, 93 % of surveyed companies hedge against FX risks. • Interest rate risk and commodity risk were substantially less significant. * The survey was conducted among large and mid-sized non-financial companies in the Czech republic in May 2005.
Value at Risk Market risk in financial institutions is primarily measured by value at risk (VaR): • Quantification of losses due to movements in financial market variables (interest rates, foreign exchange rates, equities, and commodities) in given time horizon with certain probability. • Statistical measure of potential downside risk. • Simple to explain – one number aggregates the risks across the whole company. • Time horizons usually from 1 day to 6 months. Confidence level of 95 or 99 percent.
Value at Risk vs. Cash Flow at Risk Disadvantages of Value at Risk for Non-Financial Companies • VaR measures how much the value of financial assets/liabilities – receivables, payables, equities, commodities, bonds – changes due to adverse market movement. • VaR does not cover changes in value of cash flows. • Compared to financial companies, non-financial companies have substantially higher ratio of cash flows (sales/purchases) to assets. Non-financial companies are exposed comparatively higher to changes in value of their cash flows. • The right risk measure for these companies is different – for example CFaR.
Cash Flow at Risk CFaR measures the expected maximum decrease in expected cash flows resulting from an adverse market move, within a given confidence level, for a given period
General Schematic for at-Risk Measures Input: Portfolio Holdings Portfolio Mapping P = θ (R) Mapping Procedure Transformation Procedure Input: Market Data Characterization of the Conditional Distribution of R Inference Procedure at-Risk Measure Used symbols: P … value of the portfolio/cash flows R … risk factors Value of the at-Risk Metrics
Framework of Risk Measurement To calculate CFaR the following steps are performed: • Setting time horizon and confidence interval. • Cash flow mapping. • Identifying risk factors. • Simulation of risk factors. • Revaluation of cash flows. • Constructing the probability distribution of cash flows. • Reading the value of the particular quantile of the cash flow distribution based on the confidence level.
Methodologies of at-Risk measures There are different methodologies of calculating at-Risk measures: • Variance-covariance methodology (delta-normal) • Historical simulation • Monte Carlo simulation
Delta-normal method • Simplest VAR approach. • It assumes that the portfolio exposures are linear and that the risk factors are jointly normal distributed. • Parameters of the risk factors are estimated from historical data and the distribution of the portfolio is directly calculated from the distribution of the risk factors. • Main advantage of this approach is the simplicity, but this is also its drawback. • It cannot account for nonlinear effects such as options. • Conclusion: it is a good method for measuring FX risk if the company does not hedge with FX options.
Historical simulation • The historical simulation approach is a full valuation method. • It refers to the process of calculating the hypothetical distribution of profit and losses of the current portfolio based on applying historical asset returns. • The advantage of this approach is that it does not use estimated variances and covariances, and it does not assume anything about the distribution of risk factors. • The main disadvantage is the assumption that the future risk is much like the past risk. That is less frequent in today’s fast changing business environment.
Monte Carlo Simulation • Monte Carlo simulation approach is a full valuation method. • It is the process of calculating the distribution of profit and losses of the current portfolio based on randomly generated movements in risk factors from a given distribution. • This method is the most flexible, but also carries an enormous computational burden. • It requires users to make assumptions about the stochastic process and to understand the sensitivity of the results to these assumptions.
Architecture Outline – Data Flow Market Data are redirected and stored in database User defines parameters of simulation Results from simulation are used in reporting Results Database Market Data Database Analytical Engine Exposure Database
FX Risk Measurement Tool • Ernst & Young “Light” solution for non-financial companies. • Implements Monte Carlo and Historical Simulation methods. • Let’s see the calculations.
Step 1. Setting-up Parameters • The tool supports Monte Carlo and Historical Simulation. • Up to 15 currencies. • Time horizon up to 24 months. • Various methods for estimating volatility such as simple historical average, weighted average, implied volatility • Confidence level up to 99 %.
Step 2. Entering Market Data • Necessary market data such as current and historical FX rates, interest rates and option implied volatilities are entered. • The tool supports automated upload of market data.
Step 3. Mapping Exposures • The user enters or automatically uploads currency exposures. • Forecasting properly currency exposures and aggregating it over the company or the group in time is a very demanding task for most corporate treasuries.
Step 4. Hedging Strategies • The user enters or automatically uploads portfolio of actual derivatives held by the company. The tool supports forwards, swaps and options. • The user can add any hypothetical derivatives to assess the impact of new derivatives on the FX risk.
Step 5. Calculation and Reading Results • The calculation of CFaR is conducted. Depending upon the number of simulations it takes seconds or minutes. • The user can compare CFaR for various scenarios – without derivatives, with derivatives and with hypothetical derivatives. • All the results are supported by charts.
Form of advisory support Ernst & Young provides various services in the area of corporate treasury: • Reviews. Which basically give the companies assurance that the strategies, organization, processes, and methodologies are set the right way. • Implementations. When the strategies, processes, and methodologies based on Best Practices are tailor-made for the corporations.
Contact Information Sinisa Dusic Ernst & Young d.o.o. M. Sachsa 1 10 000 Zagreb Croatia Tel. +385 1 2480 728 sinisa.dusic@hr.ey.com Pavel Riegger Ernst & Young, s.r.o. Karlovo nám. 10 120 00, Praha 2 Czech Republic Tel. +420 225 335 114 pavel.riegger@cz.ey.com