Download
1 / 9
90 likes | 162 Views
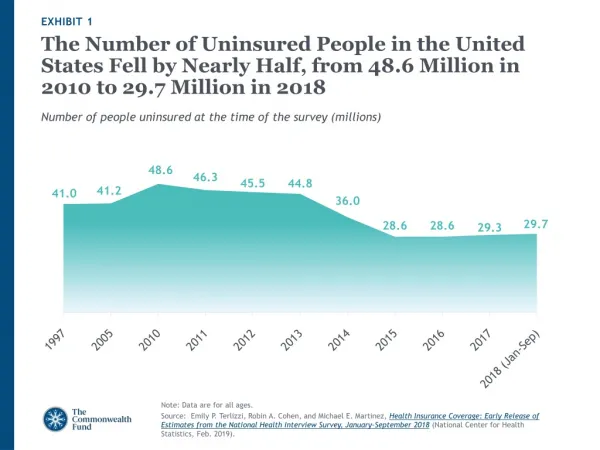
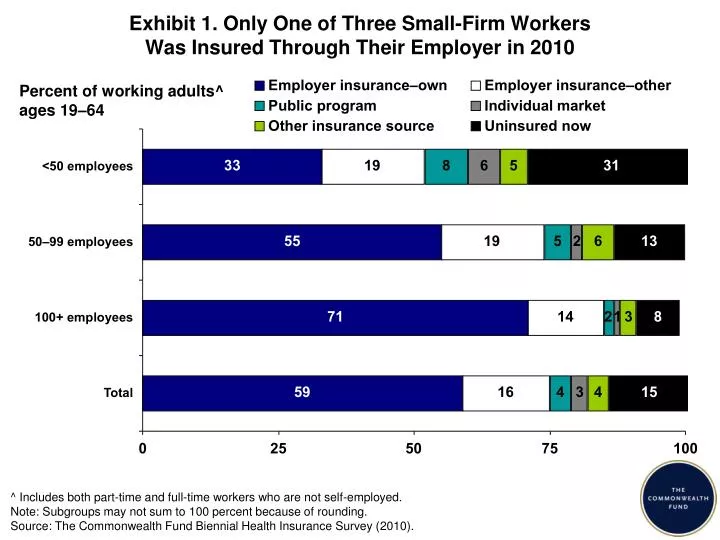
Exhibit 1. Only One of Three Small-Firm Workers Was Insured Through Their Employer in 2010. Percent of working adults^ ages 19–64. ^ Includes both part-time and full-time workers who are not self-employed. Note : Subgroups may not sum to 100 percent because of rounding.

E N D
Exhibit 1. Only One of Three Small-Firm Workers Was Insured Through Their Employer in 2010 Percent of working adults^ ages 19–64 ^ Includes both part-time and full-time workers who are not self-employed. Note: Subgroups may not sum to 100 percent because of rounding. Source: The Commonwealth Fund Biennial Health Insurance Survey (2010).
Exhibit 2. Declining Share of Small-Firm Employees Offered, Eligible for, and Covered by Own Employer Health Benefits, 2003–2010 Percent of working adults^ ages 19–64 Large firms (>100 employees) Small firms (<50 employees) Midsize firms (50–99 employees) ^ Workers include both part-time and full-time workers who are not self-employed. Source: The Commonwealth Fund Biennial Health Insurance Surveys (2003 and 2010).
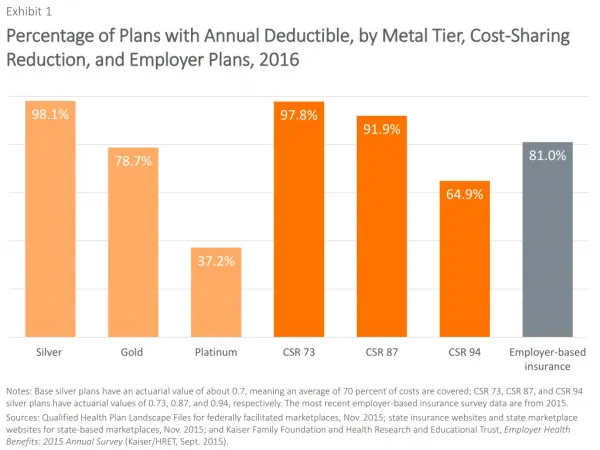
Exhibit 3. Fewer Than One of Five Low-Wage Employees in Small Firms Has a Health Plan Through Their Employer Percent of working adults^ ages 19–64 Small firms (<50 employees) Large firms (>50 employees) ^ Workers include both part-time and full-time workers who are not self-employed. Source: The Commonwealth Fund Biennial Health Insurance Survey (2010).
Exhibit 4. Employer Coverage Rates in Small Firms Declined for Low- and Higher-Wage Workers, 2003–2010 Percent of workers^ ages 19–64 covered through their own employer Large firms (>50 employees) Small firms (<50 employees) ^ Workers include both part-time and full-time workers who are not self-employed. Source: The Commonwealth Fund Biennial Health Insurance Surveys (2003 and 2010).
Exhibit 5. More Than Half of Low-Wage Workers in Small Firms Were Uninsured During 2010 Percent of working adults^ ages 19–64 54 40 33 22 19 15 7 Small firms (<50 employees) Large firms (>50 employees) ^ Includes both part-time and full-time workers who are not self-employed. Note: Subtotals may not sum to total because of rounding. Source: The Commonwealth Fund Biennial Health Insurance Survey (2010).
Exhibit 6. The Individual Insurance Market Is Not anAffordable Option for Workers and the Self-Employed ^ Includes both part-time and full-time workers. * Among those who tried to buy a plan. Source: The Commonwealth Fund Biennial Health Insurance Survey (2010).
Exhibit 7. Cost-Related Problems in Getting Needed Care Increased for Low-Wage Workers, 2003–2010 Percent of working adults^ ages 19–64 who experienced a cost-related access problem in the past year^^ Small firms (<50 employees) Large firms (>50 employees) ^ Workers include both part-time and full-time workers who are not self-employed. ^^ Any of the following due to cost: had a medical problem; did not visit doctor or clinic; did not fill a prescription; skipped recommended test, treatment, or follow-up; did not get needed specialist care. Source: The Commonwealth Fund Biennial Health Insurance Surveys (2003 and 2010).
Exhibit 8. Problems Paying Medical Bills Increased for Workers in Small Firms, 2005–2010 Percent of working adults^ ages 19–64 who experienced a problem paying medical bills or accrued medical debt in the past year^^ Large firms (>50 employees) Small firms (<50 employees) ^ Workers include both part-time and full-time workers who are not self-employed. ^^ Had problems paying or unable to pay medical bills; contacted by collection agency for unpaid medical bills; had to change way of life to pay bills; medical bills being paid off over time. Source: The Commonwealth Fund Biennial Health Insurance Surveys (2005 and 2010).
Exhibit 9. Uninsured Workers with Low and Moderate Incomes Will Be Eligible for Subsidized Insurance in 2014 Medicaid <133% FPL 10.2 million 37% Subsidized private insurance with consumer protections 133%–399% FPL 13.9 million 50% Nonsubsidized private insurance with consumer protections 400%+ FPL 3.5 million 13% 27.6 million uninsured workers, 2011 Notes: FPL refers to federal poverty level. Workers are full- and part-time workers. Source: Analysis of the March 2012 Current Population Survey by N. Tilipman and B. Sampat of Columbia University for The Commonwealth Fund.